44. Magnetic striping

We’ve discussed continental drift and plate tectonics in Proof 22. Plate tectonics. There’s another aspect of plate tectonics that was mentioned in passing there, which deserves some further attention. Proof 22 stated:

But as technology advanced, detailed measurements of the sea floor were made beginning in the late 1940s, including the structures, rock types, and importantly the magnetic properties of the rocks.

That last one, the “magnetic properties”, was the piece of evidence that really cemented continental drift as a real thing.

We pick up the history in 1947, when research expeditions led by American oceanographer Maurice Ewing established the existence of a long ridge running roughly north-south down the middle of the Atlantic Ocean. They also found that the crust beneath the ocean was thinner than that beneath the continents, and that the rocks (below the seafloor sediment) were basalts, rather than the granites predominantly found on continents. There was something peculiar about the Earth’s crust around these mid-ocean ridges. And over the next few years, more ridges were found in other oceans, revealing a network of the structures around the globe. The system of mid-ocean ridges had been discovered, but nobody yet had an explanation for it.

Meanwhile, from 1957, the Russian-American oceanographer Victor Vacquier took World War II surplus aerial magnetometers that had been used to detect submerged submarines from reconnaissance aircraft, and adapted them for use in submarines to examine the magnetic properties of the sea floor. It was well known that basalt contained the mineral magnetite, which is rich in iron and can be strongly magnetised.

What Vacquier found was unexpected and astonishing. In a survey of the Mendocino Fault area off the coast of San Francisco, Vacquier discovered that the sea floor basalt was not uniformly magnetised, but rather showed a distinctive and striking pattern. The magnetism appeared to be relatively constant along north-south lines, but to vary rapidly along the east-west direction, causing “stripes” of magnetism running north-south.[1]
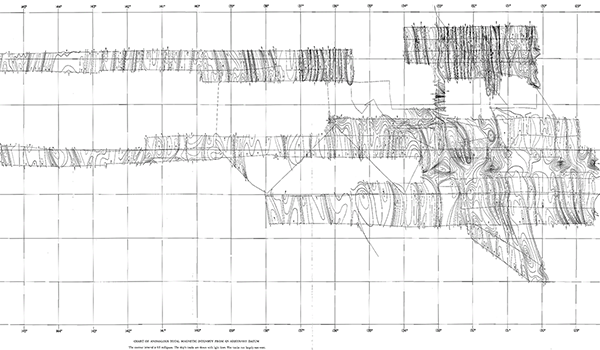
Magnetic field measurements on the sea floor near Mendocino Fault

Map of magnetic field measurements on the sea floor near Mendocino Fault, showing strong north-south striping of the magnetic field. (Figure reproduced from [1].)

Follow up observations showed that the stripes were not localised, but extended over large regions of the ocean.[2][3].
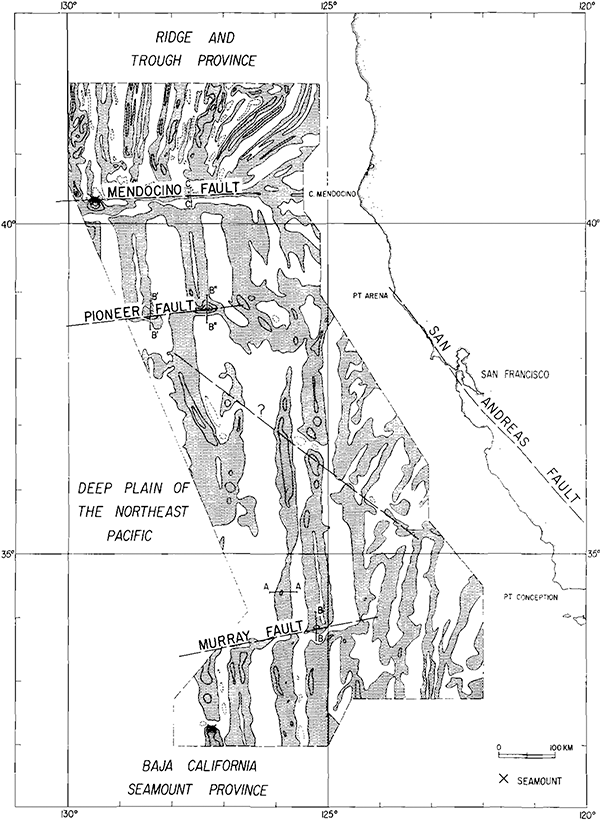
Magnetic anomalies on the sea floor off California

Map of magnetic anomalies on the sea floor off California. Shaded areas are positive magnetic anomaly, unshaded areas are negative. (Figure reproduced from [2].)

In fact, these magnetic “zebra stripes” were present pretty much everywhere on the floor of every ocean. They weren’t always aligned north-south though – it turned out that they were aligned parallel to the mid-ocean ridges. The early discoverers of this odd phenomenon had no explanation for it.

Returning to the mid-ocean ridges, American oceanographer Bruce Heezen wrote a popular article in Scientific American in 1960 that informed readers of the recent discoveries of these enormous submarine geological features.[4] In the article, he speculated that perhaps the ridges were regions of upwelling material from deep within the Earth, and the sea floors were expanding outwards from the ridges. Heezen was not aware of any mechanism for regions of Earth’s crust to disappear, so he suggested that the Earth might slowly be expanding, through the creation of new crust at the mid-ocean ridges.

Although Heezen’s idea of an expanding Earth didn’t take hold, his idea of upwelling and expansion along the mid-ocean ridges was quickly combined with existing proposals (that Heezen had overlooked) that crust could be disappearing along the lines of deep ocean trenches, as parts of the Earth moved together and were subducted downwards. The American geologists Harry Hammond Hess and Robert S. Dietz independently synthesised the ideas into a coherent theory of continental drift, combining the hypotheses of seafloor spreading and ocean trench subduction to conclude that the Earth was not changing size, but rather it was fractured into crustal plates that slowly moved, spreading apart in some places, and colliding and subducting in others.[5][6]

Proposed mantle convection by Hess

Earliest diagrams of proposed mantle convection cells causing continental drift, with upwelling at mid-ocean ridges causing seafloor spreading, by Harry Hammond Hess. Figure 7 (top) shows the detailed structure of a mid-ocean ridge, with measured seismic velocities (the speed of seismic waves in the rock) in various regions. Hess proposed that the observed lower speeds in the central and upper zones were caused by fracturing of the rock as it deforms during the upwelling, plus higher residual temperature of the upwelled material. Figure 8 (bottom) shows Hess’s proposed mantle convection cells. (Figures reproduced from [6].)

So by the 1960s, most of the observational pieces of this puzzle were in place. However, the unifying theory that would explain it all still required some synthesis, and acceptance of some unestablished hypotheses. This synthesis was again put together independently by two different groups of geologists: the Canadian Lawrence Morley, and the English Ph.D. student Frederick Vine and his supervisor Drummond Matthews. Morley wrote two papers and submitted them to Nature and the Journal of Geophysical Research in 1963, but both journals rejected his work as too speculative. Vine and Matthews thus received publication priority when Nature accepted their paper later in 1963.[7]

The geologists pointed out that if new rock was being created at the mid-ocean ridges and then spreading outwards, then the seafloor rocks should get progressively older the further away they are from the ridges. Each one of the magnetic zebra stripes running parallel to the ridges then corresponds to rocks of the same age. If, they conjectured, the rocks record the direction of the Earth’s magnetic field when they were formed, and for some reason the Earth’s magnetic field reversed direction periodically, that would explain the existence of the magnetic stripes.

Observed and modelled sea floor magnetic fields

Diagram by Vine and Matthews showing the observed magnetic field strength of the sea floor rocks measured across the Carlsberg Ridge in the Indian Ocean, showing positive and negative regions (solid lines), computed magnetic field strength under conventional (for the time) assumptions (dashed lines), and computed field strength assuming 20 km wide bands in which the Earth’s magnetic field has been reversed. The periodic field reversal matches the observed magnetism much better. (Figure reproduced from [7].)

As with Morley’s rejected papers, this paper was treated with scepticism initially, because it relied on two unproven conjectures: (1) that the rocks maintain magnetism aligned with the Earth;’s magnetic field at the time of solidification and, much more unbelievably, (2) that the Earth’s magnetic field direction reverses periodically. For some geologists, this was too speculative to be believe.

One test of Vine and Matthews’ seafloor spreading hypothesis would be to measure the age of the sea floor using some independent method. If the rocks were found to get progressively older the further away they are from the mid-ocean ridges, then that would be strong evidence in favour of the theory. As it happens, it’s possible to date the age of rocks formed from magma, using a method of radiometric dating known as potassium-argon (K-Ar) dating. Potassium is a fairly common element in rocks, and the isotope potassium-40 is radioactive, with a half-life of 1.248×10⁹ years. Most of the potassium-40 decays to calcium-40 via beta decay (see Proof 29. Neutrino beams for a recap on beta decay), but just over 10% of it decays via electron capture to the inert gas argon-40. Argon is not present in newly solidified rock, but the argon produced by decaying potassium-40 is trapped within the crystal structure. Since the decay rate is known very precisely, we can use the measured ratio of potassium to argon in the rock to determine how long it has been since it formed, for timescales from several million to billions of years.

In the mid-1960s, oceanographers and geologists began drilling cores and taking basalt samples from the sea floor and measuring their ages.[8] And what they found matched the prediction from seafloor spreading: the youngest rocks were at the ridges and became progressively older towards the edges of the oceans.
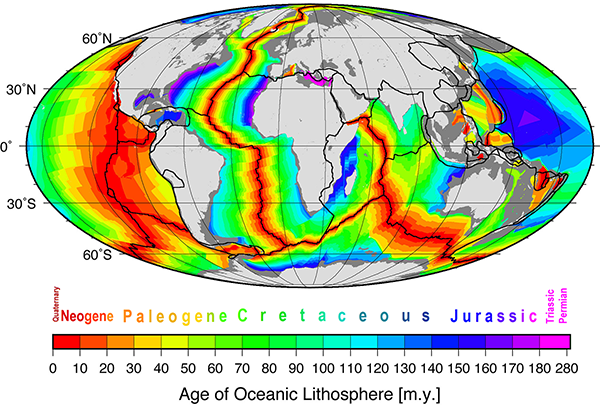
Age of oceanic crust

Diagram of the age of oceanic crust. The youngest rocks are red, and found along the mid-ocean ridges. Rocks are progressively older further away from the ridges. (Figure reproduced from [9].)

This was exactly what Vine and Matthews predicted. Belatedly, Morley also received his due credit for coming up with the same idea, and their proposal is now known as the Vine-Matthews-Morley hypothesis. The magnetic striping of the ocean floors is caused by the combination of the spreading of the ocean floors from the mid-ocean ridges, and the periodic reversal of Earth’s magnetic field.

Generation of magnetic striping

Generation of magnetic striping on the sea floor. As the sea floor spreads, and the Earth’s magnetic field reverses from time to time, stripes of different magnetic polarity are created and spread outwards. (Public domain image by the United States Geological Survey, from Wikimedia Commons.)

Odd reversals of magnetic fields in continental rocks had been noticed since 1906, when the French geologist Bernard Brunhes found that some volcanic rocks were magnetised in the opposite direction to the Earth’s magnetic field. In the 1920s, the Japanese geophysicist Motonori Matuyama noticed that all of the reversed rocks found by Brunhes and others since were older than the early Pleistocene epoch, around 750,000 years ago. He suggested that the Earth’s field may have changed direction around that time, but his proposal was largely ignored.

With the impetus provided by the seafloor spreading idea, geologists began measuring magnetic fields and ages of more rocks, and found that they matched up with the ages of the field reversals implied by the sea floor measurements. Progress was rapid and the geological community turned around and developed and adopted the whole theory of plate tectonics within just a few years. By the end of the 1960s, what had been ridiculed less than a decade earlier was mainstream, brought to that status by the confluence of multiple lines of observational evidence.

It had been established that the Earth’s magnetic field must reverse direction with periods of a few tens of thousands to millions of years. The remaining question was how?

Up until the development of plate tectonics, the origin of the Earth’s magnetic field had been a mystery. Albert Einstein even weighed in, suggesting that it might be caused by an imbalance in electrical charge between electrons and protons. But plate tectonics not only raised the question – it also suggested the answer.

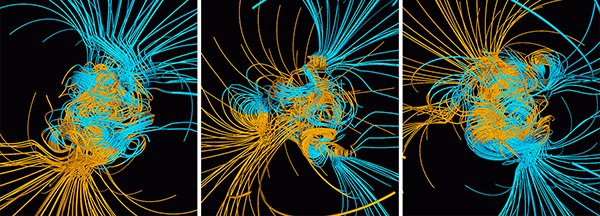
The core of the Earth was known to be mostly metallic (see Proof 43. The Schiehallion experiment). If there are convection currents in the mantle, then heat differentials at the boundary should also cause convection within the core. The convecting metal induces electrical currents, which in turn produce a magnetic field. In short, the core of the Earth is an electrical dynamo. And because the outer core is liquid, the currents are unstable. Modern computer simulations of convection in the Earth’s core readily produce instabilities that act to flip the polarity of the magnetic field at irregular intervals – exactly as observed in the record of magnetic striped sea floor rocks.

Simulations of magnetic field reversal in Earth's core

Computer simulations of convection currents in the Earth’s core and resulting magnetic field lines. Blue indicates north magnetic polarity, yellow south. The left image indicates Earth in a stable state, with a magnetic north pole at the top and a south at the bottom. The middle image is during an instability, with north and south intermingled and chaotic. The right image is after the unstable period, with the north and south poles now flipped. (Public domain images by NASA, from Wikimedia Commons.)

So we have a fully coherent and self-consistent theory that explains the observations of magnetic striping, along with many other features of the Earth’s geophysics. It involves several interlocking components: convection in the metallic core producing electric currents that generate a magnetic field that is unstable over millions of years and flips polarity at irregular intervals; convection in the mantle producing upwellings of material along mid-ocean ridges, leading to seafloor spreading and continental drift; rocks that record both their age and the direction and strength of the Earth’s magnetic field when they are formed, leading to magnetic striping on the ocean beds.

Of course, this only holds together and makes sense on a spherical Earth. We’ve already seen in Proof 8. Earth’s magnetic field, that simply generating the shape of the planet’s magnetic field only works on a spherical Earth, and is an inexplicable mystery on a flat Earth model. It would be even more difficult to explain the irregular reversal of polarity of the magnetic field without a spherical core dynamo system. And plate tectonics just doesn’t work on a flat Earth either (Proof 22. Plate tectonics). Combining the fact that neither of these explanations work on a flat Earth, there is no explanation for the observed magnetic striping of the sea floors either. So magnetic striping provides another proof that the Earth is a globe.

References:

[1] Vacquier, V., Raff, A.D., Warren, R.E. “Horizontal displacements in the floor of the northeastern Pacific Ocean”. Geological Society of America Bulletin, 72(8), p.1251-1258, 1961. https://doi.org/10.1130/0016-7606(1961)72[1251:HDITFO]2.0.CO;2

[2] Mason, R.G. Raff, A.D. “Magnetic survey off the west coast of North America, 32 N. latitude to 42 N. Latitude”. Geological Society of America Bulletin, 72(8), p.1259-1265, 1961. https://doi.org/10.1130/0016-7606(1961)72[1259:MSOTWC]2.0.CO;2

[3] Raff, A.D. Mason, R.G. “Magnetic survey off the west coast of North America, 40 N. latitude to 52 N. Latitude”. Geological Society of America Bulletin, 72(8), p.1267-1270, 1961. https://doi.org/10.1130/0016-7606(1961)72[1267:MSOTWC]2.0.CO;2

[4] Heezen, B.C. “The rift in the ocean floor”. Scientific American, 203(4), p.98-114, 1960. https://www.jstor.org/stable/24940661

[5] Dietz, R.S. “Continent and ocean basin evolution by spreading of the sea floor”. Nature, 190(4779), p.854-857, 1961. https://doi.org/10.1038%2F190854a0

[6] Hess, H.H. “History of Ocean Basins: Geological Society of America Bulletin”. Petrologic Studies: A Volume to Honour AF Buddington, p.559-620, 1962. https://doi.org/10.1130/Petrologic.1962.599

[7] Vine, F.J. Matthews, D.H. “Magnetic anomalies over oceanic ridges”. Nature, 199(4897), p.947-949, 1963. https://doi.org/10.1038/199947a0

[8] Orowan, E., Ewing, M., Le Pichon, X. Langseth, M.G. “Age of the ocean floor”. Science, 154(3747), p.413-416, 1966. https://doi.org/10.1126/science.154.3747.413

[9] Müller, R.D., Sdrolias, M., Gaina, C. Roest, W.R. “Age, spreading rates, and spreading asymmetry of the world’s ocean crust”. Geochemistry, Geophysics, Geosystems, 9(4), 2008. https://doi.org/10.1029/2007GC001743

42. Schumann resonances

A waveguide is a structure that restricts the motion of waves, disallowing propagation in certain directions, and thus concentrating the energy of the wave to propagate in specific other directions. An example of a waveguide is an optical fibre, which is basically a long, thin string of flexible glass or transparent polymer. Light entering one end is channelled along the fibre, unable to escape from the sides, and emerges at almost the same brightness from the far end.

Normally light and other electromagnetic waves, as well as other waves such as sound, spread out in three dimensions. As the energy spreads out to cover more space, conservation of energy causes the power to fall off according to the inverse square law: power falls as the reciprocal of the square of the distance from the source.

With a waveguide, propagation of the wave can be restricted to a single dimension so the energy doesn’t spread out, resulting in all of the energy being transmitted to the far end (minus a small fraction that may be absorbed or otherwise lost along the way). Sound waves, for example, can be guided by simple hollow tubes, the sound preferring to propagate along the interior air channel than penetrate the tube walls. This is the principle behind medical stethoscopes and old fashioned speaking tube systems.

Another type of waveguide is a transmission line, which is a pair of electrical cables used to transmit alternating current (AC) electrical power. The cables can simply be parallel wires in close proximity, or a coaxial cable, in which an insulated wire runs down the core of tubular conductor. Domestic AC power has a frequency of 50 to 60 hertz, which is low compared to the kilohertz range of radio frequencies. Transmission lines can carry electromagnetic waves up to frequencies of around 30 kHz. Above this, paired wires start to radiate radio waves, so they become inefficient and a different type of waveguide is used.

Radio waveguides are commonly hollow metal tubes. Radio waves travel along the tube, and the conductive metal prevents the waves from leaking to the outside. Such waveguides are used to transmit radio power in radar systems and microwaves in microwave ovens. Anywhere there is a cavity bounded by regions that waves cannot pass through, a waveguide effect can be generated.

A microwave waveguide

A microwave waveguide, which is essentially a hollow metal tube, but precisely machined to optimal dimensions and with high precision connector joints. (Creative Commons Attribution 2.0 image by Oak Ridge National Laboratory, from Flickr.)

Radio waves travel easily through the Earth’s atmosphere, to and from transmission towers and the various wireless devices we use. However the bulk of the Earth is opaque to radio waves; you generally need a mostly unobstructed line of sight, barring relatively thin obstructions like walls.

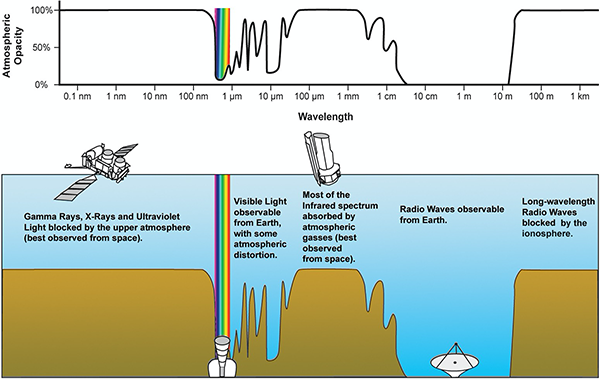
But there is another region of the Earth that is opaque to (at least some) radio waves. The ionosphere is the region of the atmosphere in which incoming solar radiation ionises the atmospheric gases (mentioned previously in 31. Earth’s atmosphere). It lies between approximately 60 to 1000 km altitude. Since ionised gas conducts electricity, low frequency radio waves cannot pass through it (higher frequencies oscillate too rapidly for the ionised particles to respond).

Opacity of atmosphere vs wavelength

Opacity of the Earth’s atmosphere as a function of electromagnetic wavelength. Long wavelength (low frequency) radio waves are blocked by the ionosphere (right). Other parts of the electromagnetic spectrum are blocked by other aspects of the atmosphere. (Modified from a public domain image by NASA, from Wikimedia Commons.)

Radio waves with wavelengths longer than about 30 metres—or frequencies below about 10 MHz—are thus trapped in the atmosphere between the Earth’s surface and the ionosphere. This forms a waveguide which can carry so-called shortwave radio signals around the world, alternately bouncing off the ionosphere and the Earth’s surface.

There are also natural sources of low frequency radio waves. Lightning flashes in storm systems produce huge discharges of electrical energy, and the sudden release of this energy generates radio waves. If you’ve ever listened to a radio during a thunderstorm you’ll be familiar with the bursts of static caused by strokes of lightning. Lightning generates broadband radio emissions, meaning it covers a wide range of radio frequencies, including the very low frequencies that are guided by the ionospheric waveguide.

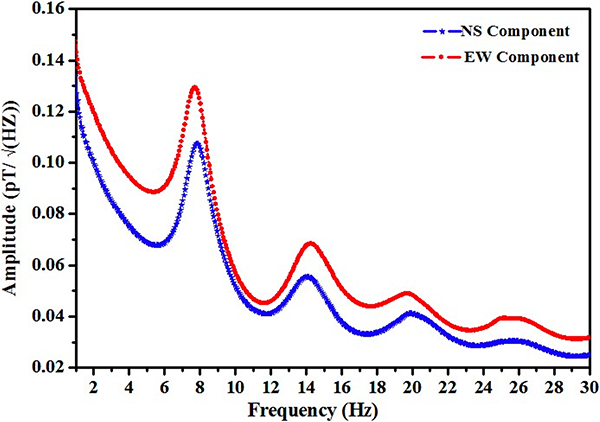
Atmospheric scientists measure the amount of lightning around the world by monitoring tiny changes in the Earth’s magnetic field, of the order of picoteslas, caused as these radio waves pass by. The sensitive detectors they use can detect lighting strikes anywhere on the planet. There are a few specific radio frequencies at which the lightning strikes turn out to be especially strong. The following plot shows the intensity of magnetic field fluctuations as a function of radio frequency.

Measurements of magnetic field fluctuation amplitude vs radio frequency

Measurements of magnetic field fluctuation amplitude versus radio wave frequency, averaged over a year of observation, at Maitri Research Station, Antarctica. (Figure reproduced from [1].)

The first peak in the observed radio spectrum is at 7.8 Hz, followed by peaks at 14.3 Hz, 20.8 Hz, and roughly every 6.5 Hz thereafter. People familiar with wave theory will recognise from the pattern that these are likely resonance frequencies, with a fundamental mode at 7.8 Hz, followed by overtones. A wave resonance occurs when an exact number of wavelengths fits into a confined cavity. The wave propagates and bounces around and, because of the precise match with the cavity size, reflected waves end up with peaks and troughs in the same physical position, reinforcing one another. So at the specific resonance frequency, the wave builds up in intensity, while at other frequencies the waves self-interfere and rapidly die down. These resonance frequencies, which are measured at many research stations around the world, are known as Schumann resonances.

The Irish physicist George Francis FitzGerald first anticipated the existence of Schumann resonances in 1893, but his work was not widely circulated. Around 1950, the German physicist Winfried Otto Schumann performed the theoretical calculations that predicted the resonances may be observable, and made efforts to observe them. But it was not until 1960 that Balser and Wagner made the first successful observations and measurements of Schumann resonances.[2]

What causes the radio waves produced by lightning flashes to have a resonance at 7.8 Hz? Well, radio waves travel at the speed of light, so let’s divide the speed of light by 7.8 to see what the wavelength is: the answer is 38,460 km. If you’ve been paying attention to many of these articles, you’ll realise that this is very close to the circumference of the Earth.

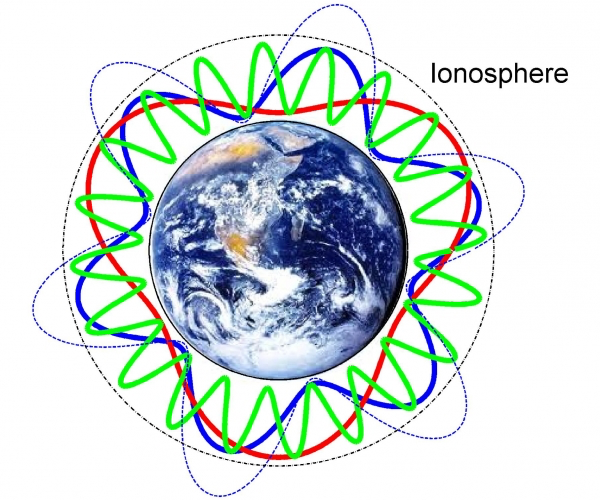
Radio waves with a frequency of 7.8 Hz are travelling around the world in the waveguide formed by the Earth and the ionosphere, and returning one wavelength later to constructively interfere and reinforce themselves, producing a measurable peak in Earth’s magnetic field fluctuations at 7.8 Hz. The resonance peak is broad and a little different to 7.5 Hz (the speed of light divided by the circumference of the Earth) because the geometry of a spherical cavity is more complicated than a simple circular loop – effectively some propagation paths are shorter because the waves don’t all take a great circle route.

Schumann resonances diagram

Illustration of Schumann resonances in the Earth’s atmosphere. The ionosphere keeps low frequency radio waves confined to a channel between it and the Earth. Waves propagate around the Earth. At specific frequencies the peaks and troughs line up, producing a resonance that reinforces those frequencies. The blue wave fits six wavelengths around the Earth, the red wave fits three. The fundamental frequency Schuman resonance of 7.8 Hz fits one wave. Not to scale: the ionosphere is much closer to the surface in reality. (Public domain image by NASA/Simoes.)

So Schumann resonances are an observed phenomenon that has a natural explanation – if the Earth is a globe.

If the Earth were flat, then any ionosphere above it would be flat as well, and would still form a waveguide for low frequency radio waves. However it would not be a closed waveguide. Radio waves would propagate out the edges and be lost to space, meaning there would be no observable magnetic field resonances at all. And even if there were an opaque radio wall of some sort at the edge of the flat Earth, the size and geometry of the resulting cavity would be different, resulting in a different set of resonance frequencies, more akin to the frequencies of a vibrating disc, which are not evenly spaced like the observed Schumann resonances.

And so Schumann resonances provide another proof that the Earth is a globe.

References:

[1] Shanmugam, M. “Investigation of Near Earth Space Environment”. Ph.D. Thesis, Manonmaniam Sundaranar University, 2016. https://www.researchgate.net/publication/309209580_Investigation_of_Near_Earth_Space_Environment

[2] Balser, M., Wagner, C. “Observations of Earth–Ionosphere Cavity Resonances”. Nature, 188, p. 638-641, 1960. https://doi.org/10.1038/188638a0

41. Cosmic rays

The French physicist Henri Becquerel discovered the phenomenon of radioactivity in 1896, while performing experiments on phosphorescence – the unrelated phenomenon that causes “glow in the dark” materials to glow for several minutes after being exposed to light. He was interested to see if phosphorescence was related to x-rays, discovered only a few months earlier by Wilhelm Roentgen. In his experiments, Becquerel noticed that uranium salts could darken photographic film, even if wrapped in black paper so that no light could fall on the film, and even from non-phosphorescent uranium samples. The conclusion was that some sort of penetrating rays were being emitted by the uranium itself, without being excited by external energy.

Henri Becquerel in his lab width=

Henri Becquerel in his lab. (Public domain image from Wikimedia Commons.)

Marie and Pierre Curie quickly discovered other radioactive elements, and Becquerel himself discovered by experimenting with magnets that there were three different types of radioactive radiation: two deflected in different directions by a magnetic field and one not deflected at all. In 1899, Ernest Rutherford characterised the first two types, naming them alpha and beta particles, with positive and negative electric charges. Becquerel measured the mass/charge ratio of beta particles in 1900 and determined that they were the same as the electrons discovered by J. J. Thomson in 1897. In 1907 Rutherford showed that alpha particles were the nuclei of helium atoms. And in 1914, he showed that the third type of radiation, named gamma rays, were a form of electromagnetic radiation.

Ernest Rutherford with Hans Geiger

Ernest Rutherford (right), in his lab with Hans Geiger (left), inventor of the Geiger counter. (Public domain image from Wikimedia Commons.)

This was an exciting time in physics, and our understanding of atomic structure was revolutionised within the space of two decades. Besides discovering the basic structure of the atom and how it related to the phenomenon of radioactive decay, several peripheral phenomena also came to the attention of scientists.

One observation was that atoms in the atmosphere were sometimes ionised, or “electrified” as the scientists of the time described it. Ionisation is the process of electrons being stripped off neutral atoms, to form negatively charged free electrons and positively charged atomic ions (consisting of the atomic nucleus and a less-than-full complement of electrons). It was clear that radioactive rays could ionise atoms in the air, and so scientists assumed that it was radiation from radioactive elements in the ground that was ionising the air near ground level.

Father Theodor Wulf

Except strangely the amount of ionising radiation in the atmosphere seemed to increase with increasing altitude. German physicist and Jesuit priest Theodor Wulf invented in 1909 a portable electroscope capable of measuring the ionisation of the atmosphere. He used it to investigate the source of the ionising radiation by measuring ionisation at the base and the top of the Eiffel Tower. He found that the ionisation at the top of the 300 metre tower was a bit over half that at ground level, which was higher than he expected, since theoretically he expected the ionisation to drop by half every 80 metres, so to be less than one tenth the ionisation at ground level. He concluded that there must be some other source of ionising radiation coming from above the atmosphere. However, his published paper was largely ignored.

In 1911, the Italian physicist Domenico Pacini measured the ionisation rates in various places, including mountains, lakes, seas, and underwater. He showed that the rate dropped significantly underwater, and concluded that the main source of radiation could not be the Earth itself. Then in 1912, Austrian physicist Victor Hess took some Wulf electroscopes up in a hot air balloon to altitudes as high as 5300 metres, flying both in daylight, night time, and during an almost complete solar eclipse.

Victor Hess in a hot air balloon flight

Victor Hess (centre), after one of his balloon flight experiments. (Public domain image from Wikimedia Commons.)

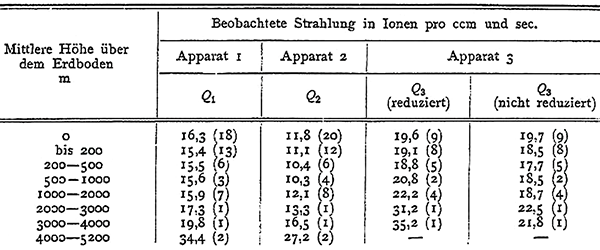
Hess showed that the amount of ionising radiation decreased as one moved from ground level up to about 1000 metres, but then increased again rapidly. At 5300 metres, there was approximately twice as much ionising radiation as at ground level.[1] And because the effect occurred at night, and during a solar eclipse, it wasn’t due to the sun. Hess had proven that there was a source of this radiation outside the Earth’s atmosphere. Further unmanned balloon flights as high as 9 km showed the radiation increased even higher with altitude.

Atmospheric radiation readings recorded by Victor Hess

Readings of ionising radiation level (columns 2 to 4) at different altitudes (column 1, in metres), as recorded by Victor Hess. (Figure reproduced from [1].)

What this mysterious radiation was remained unknown until the late 1920s. It was initially thought to be electromagnetic radiation (i.e. gamma rays and x-rays). Robert Millikan named them cosmic rays in 1925 after proving that they originated outside the Earth. Then in 1927 the Dutch physicist Jacob Clay performed measurements while sailing from Java to the Netherlands, which showed that their intensity increased as one moved from the tropics to mid-latitudes.[2] He correctly deduced that the intensity was affected by the Earth’s magnetic field, which implied the cosmic rays must be charged particles.

Atmospheric radiation readings recorded by Jacob Clay

Data recorded by Jacob Clay showing change in ionising radiation with latitude during his voyage from Java to Europe. (Figure reproduced from [2].)

In 1930, the Italian Bruno Rossi realised that if cosmic rays are electrically charged, then they should be deflected either east or west by the Earth’s magnetic field, depending on whether they are positively or negatively charged, respectively.[3] Experiments found that at all locations on the Earth’s surface there are more cosmic rays coming from the west than from the east, showing that most (if not all) cosmic ray particles are positively charged. This observation was called the east-west effect.

Illustration showing incoming cosmic rays deflected to the east

Illustration of the east-west effect. In the space around the Earth (shown as black in this diagram), the Earth’s magnetic field is directed perpendicularly out of the diagram. Incoming cosmic rays are shown in red. When they encounter Earth’s magnetic field, charged particles are deflected perpendicular to the field direction. Positively charged particles are deflected to the right, as shown, meaning that from the surface of the Earth, cosmic rays tend to preferentially come from the west.

Subsequent experiments determined that around 90% of cosmic rays entering our atmosphere are protons, 9% are helium nuclei (or alpha particles), and the remaining 1% are nuclei of heavier elements, with an extremely small number of other types of particles. And in 1936, for his crucial part in the discovery in cosmic rays, Victor Hess was awarded the Nobel Prize for Physics.

The origin of cosmic rays is however still not entirely clear. Our sun produces energetic particles that reach Earth, but cosmic rays are generally defined as coming from outside our own solar system. Our Milky Way Galaxy produces some of the lower energy particles, mostly from the direction of the galactic core, however at very high energies there is a deficit of cosmic rays in that direction, implying a shadowing effect on rays whose origin lies outside our galaxy. Known sources of cosmic rays include supernova explosions, supernova remnants (such as the Crab Nebula), active galactic nuclei, and quasars. But there are some very high energy cosmic rays whose source is still a mystery.

The fact that high energy cosmic rays originate from outside our galaxy, means that they should be isotropic – uniform in intensity distribution, independent of the direction from which they approach Earth. However, the Earth is not a stationary observation platform. The Earth orbits the sun at a speed of almost 30 km/s. But on a galactic scale this motion is dwarfed by the sun’s orbital speed around the core of our galaxy, which is 230 km/s, roughly in the direction of the star Vega, in the constellation Lyra. So relative to extragalactic cosmic rays, Earth is moving at an average speed of approximately 230 km/s. This speed adds to the energy of cosmic rays coming from the direction of Vega, and subtracts from the energies of cosmic rays coming from the opposite direction.

Diagram showing our sun's orbit about the galaxy

Our sun orbits the centre of the Milky Way Galaxy, at a speed of 230 km/s. This speed modifies the speed and direction of incoming cosmic rays from outside the Galaxy. (Modified from a public domain image by NASA, from Wikimedia Commons.)

This difference is known as the Compton-Getting effect after the discoverers Arthur Compton and Ivan Getting.[4] It produces about a 0.1% difference in the energies of cosmic rays coming from the opposite directions, which can be observed statistically. The effect was confirmed experimentally in 1986.[5]

So we have two different observational effects that have been experimentally confirmed in the distribution of cosmic rays arriving at Earth. The Compton-Getting effect shows that the Earth is moving in the direction of the star Vega. Vega is of course above the Earth’s horizon as seen from half the planet’s surface at any one time, and below the horizon (behind the planet) from the other half of the Earth’s surface. By measuring cosmic ray distributions, you can show that the direction defined by the Compton-Getting anisotropy relative to the ground plane varies depending on your position on Earth. In other words, by measuring cosmic rays, you can prove that the Earth’s direction of motion through the galaxy is upwards from the ground in one place, while simultaneously downwards into the ground from a point on the opposite side of the planet, and at intermediate angles in places in between. Which is perfectly consistent for a spherical planet, but inconsistent with a Flat Earth.

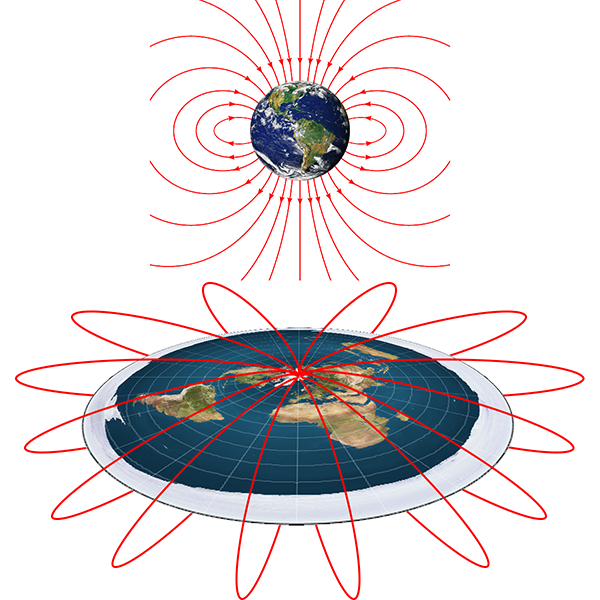
The second effect, the east-west effect, is also readily explained with a spherical Earth, with the addition of a simple dipole magnetic field. As can be seen in the diagram above (“Illustration of the east-west effect”), incoming positively charged cosmic rays are uniformly deflected to the right (as viewed from above Earth’s North Pole), resulting in more rays arriving from the west than from the east, independent of location or time of day. The same observed east-west effect could in theory be produced on a Flat Earth, but only if the magnetic field is flattened out as well, holding the same relative orientation to the Earth’s surface as it does on the globe.

Magnetic field as required for the east-west effect, on spherical and flat Earths

Shape of magnetic fields to produce the observed east-west effect in incoming cosmic rays. The required magnetic field for a spherical Earth is very close to a simple dipole, easily generated with known physical principles. The required magnetic field shape for a flat Earth is severely flattened, and cannot be produced with a simple magnetic dynamo model.

This would result in the field being grossly distorted from that of a simple dipole, and thus requiring some exotic method of generating such a complex field – a complex field that just happens to mimic exactly the field of a straightforward dipole if the Earth were spherical. In another application of Occam’s razor (similar to its use in article 8. Earth’s magnetic field), it is more parsimonious to conclude that the Earth is not flat, but spherical.

References:

[1] Hess, V.F. “Über Beobachtungen der durchdringenden Strahlung bei sieben Freiballonfahrten” (Observation of penetrating radiation in seven free balloon flights). Physikalische Zeitschrift, 13, p.1084-1091, 1912. http://inspirehep.net/record/1623161/

[2] Clay, J. “Penetrating radiation”. Proceedings of the Royal Academy of Sciences Amsterdam, 30, p. 1115-1127, 1927. https://www.dwc.knaw.nl/DL/publications/PU00011919.pdf

[3] Rossi, B. “On the magnetic deflection of cosmic rays”. Physical Review, 36(3), p. 606, 1930. https://doi.org/10.1103/PhysRev.36.606

[4] Compton, A. H., Getting, I. A. “An Apparent Effect of Galactic Rotation on the Intensity of Cosmic Rays”. Physical Review, 47, p. 817-821, 1935. https://doi.org/10.1103/PhysRev.47.817

[5] Cutler, D., Groom, D. “Observation of terrestrial orbital motion using the cosmic-ray Compton–Getting effect”. Nature, 322, p. 434-436, 1986. https://doi.org/10.1038/322434a0

11. Auroral ovals

Aurorae are visible light phenomena observed in the night sky, mostly at high latitudes corresponding to Arctic and Antarctic regions. An aurora can appear as an indistinct glow from a distance or as distinct shifting curtain-like formations of light, in various colours, when seen from nearby.

An aurora

An aurora, observed near Eielson Air Force Base, near Fairbanks, Alaska. (Public domain image by Senior Airman Joshua Strang, United States Air Force.)

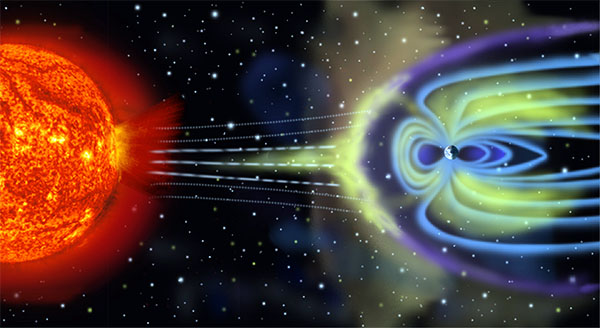
Aurorae are caused by the impact on Earth’s atmosphere of charged particles streaming from the sun, known as the solar wind.

Solar wind and Earth's magnetosphere

Schematic representation of the solar wind streaming from the sun and interacting with the Earth’s magnetic field. The dashed lines indicate paths of solar particles towards Earth. The solid blue lines show Earth’s magnetic field. (Public domain image by NASA.)

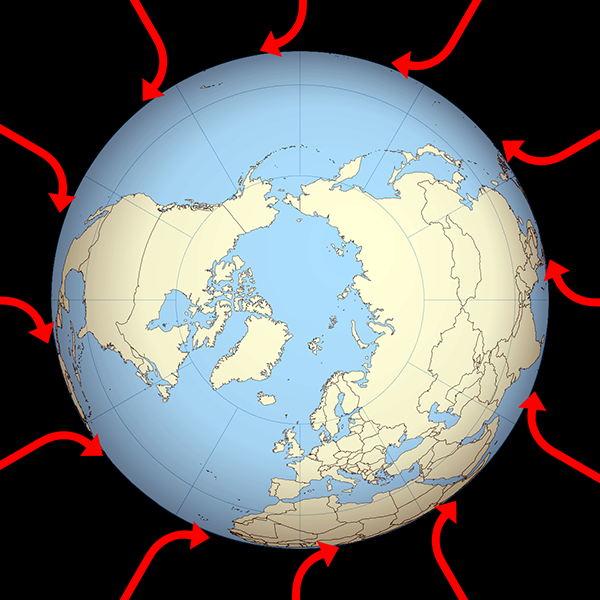
The Earth’s magnetic field captures the particles and deflects them (according to the well-known laws of electromagnetism) so that they spiral downwards around magnetic field lines. The result is that the particles hit the atmosphere near the Earth’s magnetic poles.

Solar wind interacting with Earth's magnetosphere

Diagram of the solar wind interacting with Earth’s magnetic field (field lines in red). The magnetic field deflects the incoming particles around the Earth, except for a fraction of the particles that enter the magnetic polar funnels and spiral down towards Earth’s magnetic poles. (Public domain image by NASA. modified.)

The incoming high energy particles ionise nitrogen atoms in the upper atmosphere, as well as exciting oxygen atoms and nitrogen molecules into high energy states. The recombination of nitrogen and the relaxation of the high energy states results in the emission of photons. The light is produced between about 90 km and 150 km above the surface of the Earth, as shown by triangulating the positions of aurorae from multiple observing locations.

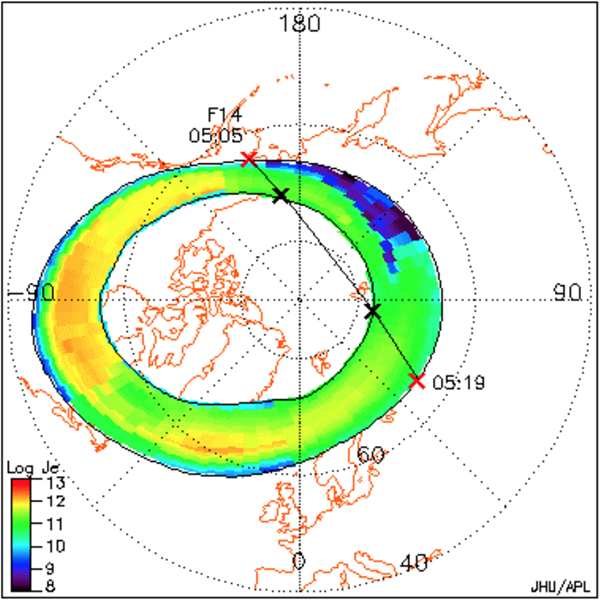
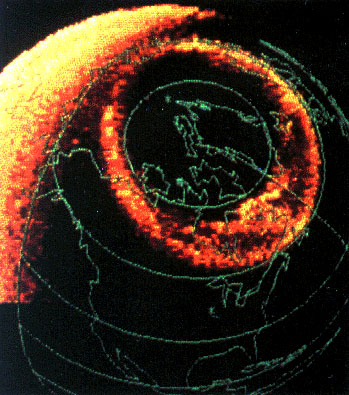
Observations of aurorae have established that they occur in nearly-circular elliptical rings of width equivalent to a few degrees of latitude (i.e. a few hundred kilometres), usually between 10° and 20° from the Earth’s magnetic poles. These rings, in the northern and southern hemispheres, are called the auroral ovals.

Northern auroral oval

Northern auroral oval observed on 22 January 2004. Figure reproduced from [1].

The auroral ovals are not precisely centred on the magnetic poles, but rather are pushed a few degrees towards the Earth’s night side. This is caused by the diurnal deflection of the Earth’s magnetic field by pressure from the charged particles of the solar wind.

Northern auroral oval seen by DE-1

Northern auroral oval observed in 1983 by Dynamics Explorer 1 satellite. The large bright patch at left is the daylight side of Earth. (Public domain image by NASA.)

The auroral ovals also expand when solar activity increases, particularly during solar storms, when increased particle emission from the sun and the resulting stronger solar wind compresses the Earth’s magnetic field, forcing field lines to move away from the poles.

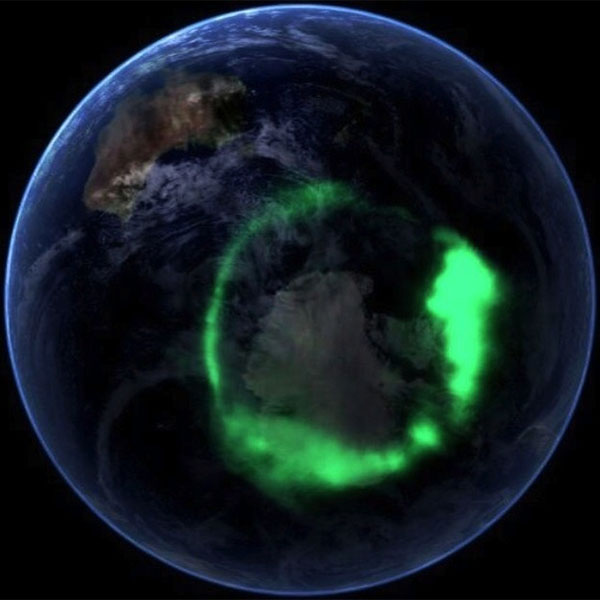
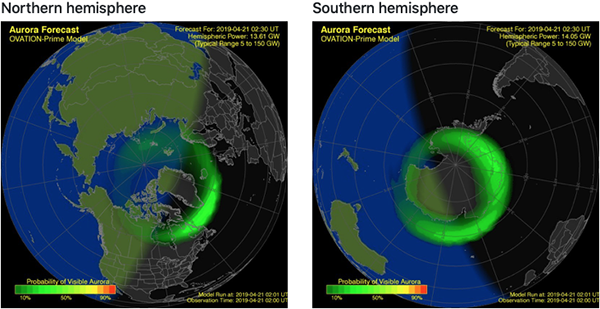
But despite these variations, the auroral ovals in the northern and southern hemispheres move and change sizes more or less in unison, and are always of similar size.

Southern auroral oval

Southern auroral oval observed in 2005 by IMAGE satellite, overlaid on a Blue Marble image of Earth. (Public domain image by NASA.)

You can see the current locations and sizes of both the northern and southern auroral ovals as forecast based on the solar wind and interplanetary magnetic field conditions as measured by the Deep Space Climate Observatory satellite at https://www.spaceweatherlive.com/en/auroral-activity/auroral-oval.

Northern and southern auroral ovals

Current northern and southern auroral ovals as forecast by spaceweatherlive.com on 21 April, 2019. The auroral ovals are the same size and shape.

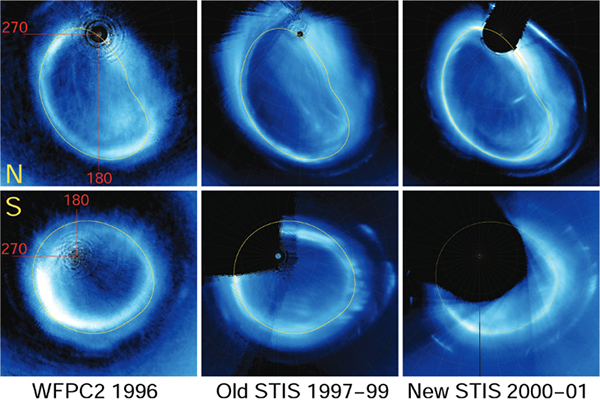
Earth is not the only planet to display aurorae. Jupiter has a strong magnetic field, which acts to funnel the solar wind towards its polar regions in the same way as Earth’s field does on Earth. Jupiter we can establish by simple observation from ground-based telescopes is close to spherical in shape and not a flat disc. Auroral ovals are observed on Jupiter around both the northern and southern magnetic poles, exactly analogously to on Earth: of close to the same size and shape.

Northern auroral ovals on Jupiter

Auroral ovals on Jupiter observed in the northern and southern polar regions by the Hubble Space Telescope, using the Wide Field Planetary Camera (1996) and the Space Telescope Imaging Spectrograph (1997-2001). Figure reproduced from [2].

Similar auroral ovals are also seen on Saturn, in both the northern and southern hemispheres [3][4]. And just for the record, Saturn is also easily shown to be spherical in shape, and not a flat disc.

Now, we have established that auroral ovals appear on three different planets, with the southern and northern ovals of close to the same sizes and shapes on each individual planet. Everything is consistent and readily understandable – as long as you assume that the Earth is spherical like Jupiter and Saturn.

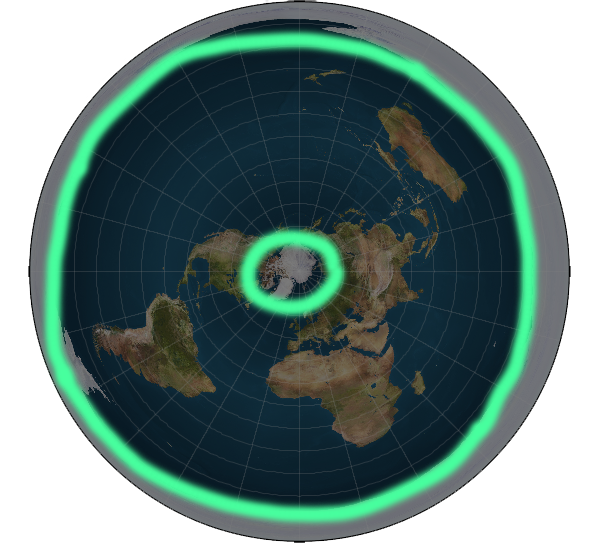
If the Earth is flat, however, then the distributions of aurorae in the north and south map to very different shapes and sizes – with no ready explanation for either the shapes or their differences. In particular, large parts of the southern auroral oval end up being extremely far from the southern magnetic pole, in defiance of the electromagnetic mechanism that causes aurorae in the first place.

Auroral ovals on a flat Earth

Auroral ovals in their observed locations, mapped onto a flat disc Earth. The ovals are vastly different sizes.

So the positions of aurorae on a flat Earth cannot be readily explained by known laws of physics, and they also do not resemble the locations and sizes of auroral ovals as observed on other planets. All of these problems go away and become self-consistent if the Earth is a globe.

References:

[1] Safargaleev, V., Sergienko, T., Nilsson, H., Kozlovsky, A., Massetti, S., Osipenko1, S., Kotikov, A. “Combined optical, EISCAT and magnetic observations of the omega bands/Ps6 pulsations and an auroral torch in the late morning hours: a case study”. Annales Geophysicae, 23, p. 1821-1838, 2005. https://doi.org/10.5194/angeo-23-1821-2005

[2] Grodent, D.,Clarke, J. T., Kim, J., Waite Jr., J. H., Cowley, S. W. H. “Jupiter’s main auroral oval observed with HST‐STIS”. Journal of Geophysical Research, 108, p. 1389-1404, 2003. https://doi.org/10.1029/2003JA009921

[3] Cowley, S. W. H., Bunce, E. J., Prangé, R. “Saturn’s polar ionospheric flows and their relation to the main auroral oval”. Annales Geophysicae, 22, p.1379-1394, 2004. https://doi.org/10.5194/angeo-22-1379-2004

[4] Nichols, J. D., Clarke, J. T., Cowley, S. W. H., Duval, J., Farmer, A. J., Gérard, J.‐C., Grodent, D., Wannawichian, S. “Oscillation of Saturn’s southern auroral oval”. Journal of Geophysical Research, 113, A11205, 2008. https://doi.org/10.1029/2008JA013444

8. Earth’s magnetic field

Magnetic fields have both a strength and a direction at each point in space. The strength is a measure of how strong a force a magnet feels when in the field, and the direction is the direction of the force on a magnetic north pole. North poles of magnets on Earth tend to be pulled towards the Earth’s North Magnetic Pole (which is in fact a magnetic south pole, but called “the North Magnetic Pole” because it is in the northern hemisphere), while south poles are pulled towards the South Magnetic Pole (similarly, actually a magnetic north pole, called “the South Magnetic Pole” because it’s in the south). Humans have used this property of magnets for thousands of years to navigate, with magnetic compasses.

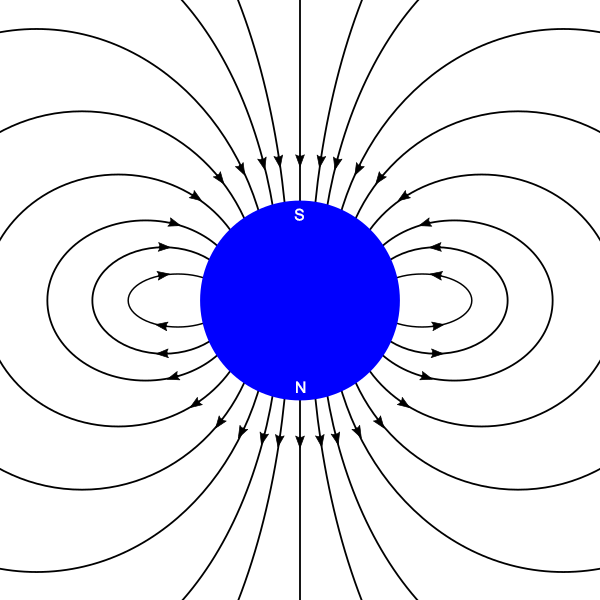
The simplest magnetic field is what’s known as a dipole, because it has two poles: a north pole and a south pole. You can think of this as the magnetic field of a simple bar magnet. The magnetic field lines are loops, with the field direction pointing out of the north pole and into the south pole, and the loops closing inside of the magnet.

A magnetic dipole

Illustration of magnetic field lines around a magnetic dipole. The north and south poles of the magnet are marked.

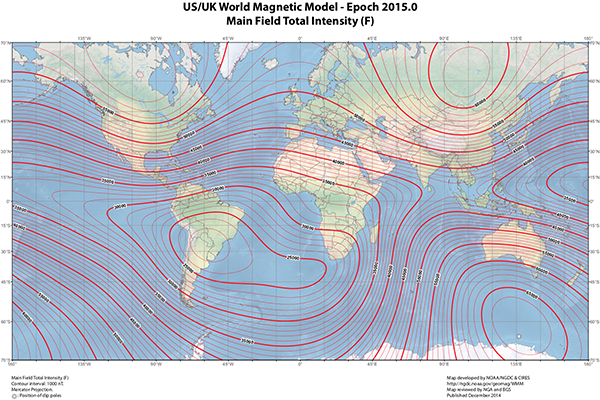
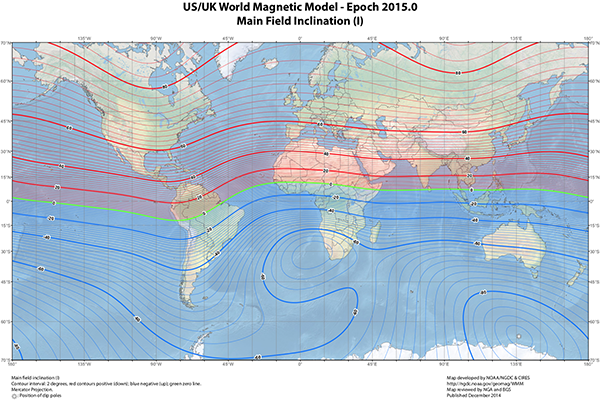
It’s straightforward to measure both the strength and the direction of the Earth’s magnetic field at any point on the surface, using a device known as a magnetometer. So what does it look like? Here are some contour maps showing the Earth’s magnetic field strength and the inclination – the angle the field lines make to the ground.

Earth's magnetic field intensity

Earth’s magnetic field strength. The minimum field strength occurs over South America; the maximum field strengths occur just off Antarctica, south of Australia, and in the broad patch covering both central Russia and northern Canada. (Public domain image by the US National Ocean and Atmospheric Administration.)

Earth's magnetic field inclination

Earth’s magnetic field inclination. The field direction is parallel to the ground at points along the green line, points into the ground in the red region, and points out of the ground in the blue region. The field emerges vertically at the white mark off the coast of Antarctica, south of Australia – this is the Earth’s South Magnetic Pole. The field points straight down at the North Magnetic Pole, north of Canada – not shown in this Mercator projection map, which omits areas with latitude greater than 70° north or south. (Public domain image by the US National Ocean and Atmospheric Administration.)

Now, how can we explain these observations with either a spherical Earth or flat Earth model? Let’s start with the spherical model.

You may notice a few things about the maps above. The Earth’s magnetic field is not symmetrical at the surface. The lowest intensity point over South America is not mirrored anywhere in the northern hemisphere. And the South Magnetic Pole is at a latitude about 64°S, while the North Magnetic Pole is at latitude 82°N. As it happens, this observed magnetic field is to a first approximation the field of a magnetic dipole – just not a dipole that is centred at the centre of the Earth. The dipole is tilted with respect to Earth’s rotation, and is offset a bit to one side – towards south-east Asia and away from South America. This explains the minimum intensity in South America, and the asymmetry of the magnetic poles.

A magnetic dipole

The Earth’s magnetic field is approximated by a dipole, offset from the centre of the Earth. The rotational axis is the light blue line, with geographic north and south poles marked. The red dots are the equivalent magnetic poles. The North Magnetic Pole is much closer to the geographic north pole than the South Magnetic Pole is to the geographic south pole. (As stated in the text, the “North Magnetic Pole” of the Earth is actually a magnetic south pole, and vice versa.)

Models of the interior of the Earth suggest that there are circulating electrical currents in the molten core, which is composed mostly of iron. These currents are caused by thermal convection, and twisted into helices by the Coriolis force produced by the Earth’s rotation, both well understood physical processes. Circulating electrical currents are exactly what causes magnetic fields. The simplest version of this so-called dynamo theory model is one in which there is a single giant loop of current, generating a simple magnetic dipole. And in fact this dipole fits the Earth’s magnetic field to an average deviation of 16% [1].

This is not a perfect fit, but it’s not too bad. The adjustments needed to better fit Earth’s measured field are relatively small, and can also be understood as the effects of circulating currents in the Earth’s core, causing additional components of the field with smaller magnitudes. (The Earth’s magnetic field also changes over time, but we’ll discuss that another day: Now available in Proof 44. Magnetic striping.)

If the Earth is flat, however, there is no such relatively simple way to understand the strength and direction of Earth’s magnetic field using standard electromagnetic theory. Even the gross overall structure—which is readily explained by a magnetic dipole for the spherical Earth—has no such simple explanation. The shape of the field on a flat Earth would require either multiple electrical dynamos or large deposits of magnetic materials under the Earth’s crust, and they would have to be fortuitously arranged in such a way that they closely mimic a dipole if we assumed the Earth to be a sphere. For any random arrangement of magnetic field-inducing structures on a flat Earth to happen to mimic the field of a spherical planet so closely is highly unlikely. Potentially it could happen, but the Earth actually being a sphere is a much more likely explanation.

That the simpler model is more likely to be true than the one requiring many ad-hoc assumptions is a case of Occam’s razor. In science, particularly, a simpler theory is more easily testable than one with a large number of ad-hoc assumptions. Occam’s razor will come up a lot, and I should probably write a sidebar article about it.

References:

[1] Nevalainen, J.; Usoskin, I.G.; Mishev, A. “Eccentric dipole approximation of the geomagnetic field: Application to cosmic ray computations”. Advances in Space Research, 52, p. 22-29, 2013. https://doi.org/10.1016/j.asr.2013.02.020