Our planet is made largely of rocks and metals. The composition and physical state varies with depth from the core of the Earth to the surface, because of changes in pressure and temperature with depth. The uppermost layer is the crust, which consists of lighter rocks in a solid state. Immediately below this is the upper mantle, in which the rocks are hotter and can deform plasticly over millions of years.
Slow convection currents occur in the upper mantle, and the convection cells define the tectonic plates of the Earth’s crust. Where mantle material rises, magma can emerge at mid-oceanic ridges or volcanoes. Where it sinks, a subduction zone occurs in the crust.
The plate boundaries are thus particularly unstable places on the Earth. As the plates shift and move relative to one another, stresses build up in the rock along the edges. At some point the stress becomes too great for the rock to withstand, and it gives way suddenly, releasing energy that shakes the Earth locally. These are earthquakes.
The point of slippage and the release of energy is known as the hypocentre of the earthquake, and may be several kilometres deep underground. The point on the surface above the hypocentre is the epicentre, and is where potential destruction is the greatest. Most earthquakes are small and go relatively unnoticed except by the seismologists who study earthquakes. Sometimes a quake is large and can cause damage to structures, injuries, and loss of life.
The energy released in an earthquake travels through the Earth in the form of waves, known as seismic waves. There are a few different types of seismic wave.
Primary waves, or P waves, are compressional waves, like sound waves in air. The rock alternately compresses and experiences tension, in a direction along the axis of propagation. In fact P waves are essentially sound waves of very large amplitude, and they propagate at the speed of sound in the medium. Within surface rock, this is about 5000 metres per second. Primary waves are so called because they are the fastest seismic waves, and thus the first ones to reach seismic recording stations located at any distance from the epicentre. They travel through the body of the Earth. And like sound waves, they can travel through any medium: solid, liquid, or gas.
Secondary waves, or S waves, are transverse waves, like light waves, or waves travelling along a jiggled rope. The rock jiggles from side to side as the wave propagates perpendicular to the jiggling motions. S waves travel a little over half the speed of P waves, and are the second waves to be detected at remote seismic stations. S waves also travel through the body of the Earth, but only within solid material. Fluids have no shear strength, and so cannot return to an equilibrium position when a transverse wave hits it, so the energy is dissipated within the fluid.
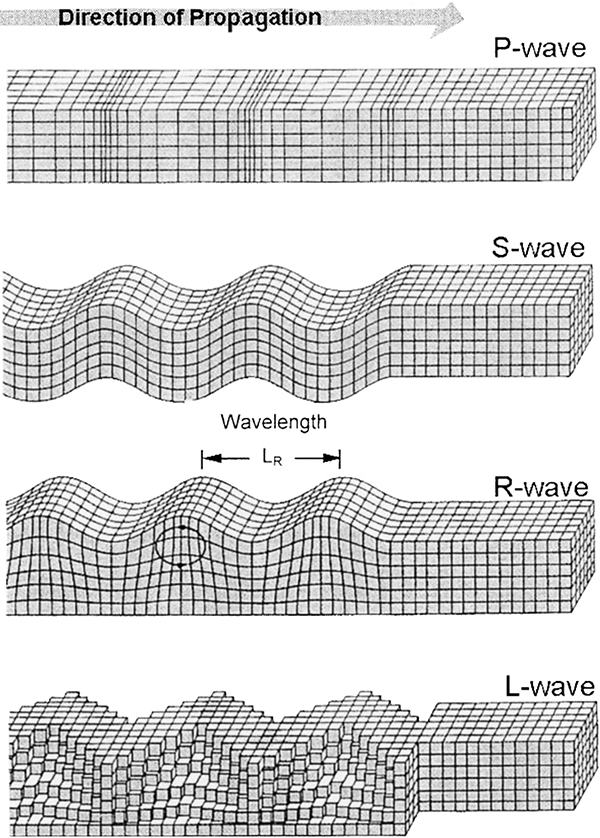
Besides these two types of body waves, there are also surface waves, which travel along the surface of the Earth. One type, Rayleigh waves (or R waves, named after the physicist Lord Rayleigh), are just like the surface waves or ripples on water, and causes the surface of the Earth to heave up and down. Another type of surface wave causes side to side motion; these are known as Love waves (or L waves, named after the mathematician Augustus Edward Hough Love). These waves propagate more slowly than S waves, at around 90% of the speed. Love waves are generally the strongest and most destructive seismic waves.
The P and S waves are thus the first two waves detected from an earthquake, and they are easily distinguishable on seismometer recordings.

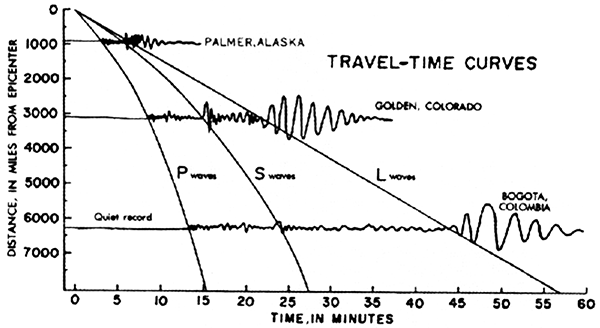
The P waves arrive first and produce a pulse of activity which slowly fades in amplitude, then the S waves arrive and cause a larger amplitude burst of activity. Because the relative speeds of the two waves through the same material are known, the time between the arrival of the P and S waves can be used to determine the distance from the seismic station to the earthquake hypocentre, using a graph such as the following:
The graph shows the travel times of P, S, and also L waves, plotted against distance from the earthquake on the vertical axis. As you can see, the time between the detection of the P and S waves increases steadily with the distance from the quake.
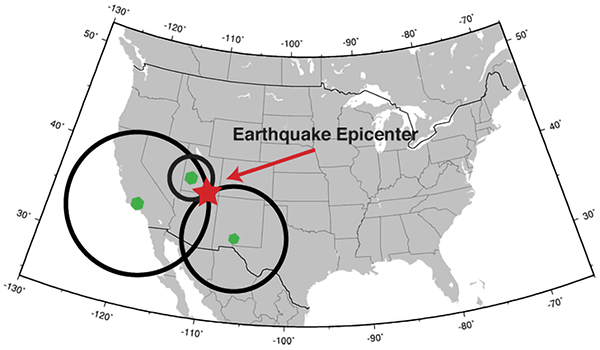
If you have three seismic stations, you can triangulate the location of the epicentre (using trilateration, as we have previously discussed).
Of course, if you have more than three seismic stations, you can pinpoint the location of the earthquake much more reliably and precisely. According to the International Registry of Seismograph Stations, there are over 26,000 seismic stations around the world.
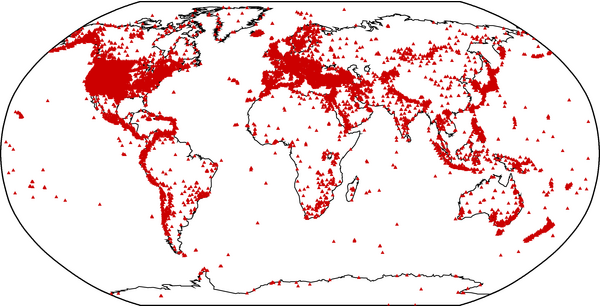
Interestingly, notice how the world’s seismic stations are concentrated along plate boundaries, where earthquakes are most common, particularly around the Pacific rim, as well as heavily in the developed nations of the US and Europe.
As shown in the travel-time curve graph, you can also use the propagation time of L waves to estimate distance to the earthquake. Did you notice the difference between the shapes of the P and S wave curves, and the L wave curve? L waves travel along the surface of the Earth. The distance from an earthquake to a detection station is measured conventionally, like everyday distances, also along the surface of the Earth. Since the L waves propagate at a constant speed, the graph of distance (along the Earth’s surface) versus time is a straight line.
But the P and S waves don’t travel along the surface of the Earth. They propagate through the bulk of the Earth. The distance that a P or S wave needs to travel from earthquake to detection site increases more slowly than the distance along the surface of the Earth, because of the Earth’s spherical shape. The S waves are only about 10% faster than the L waves, and you can see that near the epicentre, they arrive only around 10% earlier than the L waves. But the further away the earthquake is, the more of a shortcut they can take through the Earth, and so the faster they arrive, resulting in the downward curve on the graph. Similarly for the P waves.
This is in fact not the only cause of the P and S waves appearing to get faster the further away you are from an earthquake. They actually do get faster as they travel deeper, because of changes to the rock pressure. Deep in the Earth they can travel at roughly twice the speed that they do near the surface. The combination of these effects causes the shape of the curves in the travel-time graph.
If we consider the propagation of seismic waves from an earthquake, they spread out in circles around the epicentre, like ripples in a pond from where a stone is dropped in. The arrival times of the waves at seismic stations equidistant from the epicentre should be the same, since the speeds in any direction are the same. And this is of course what is observed. The following figures show the predicted spread of P waves across the Earth from earthquake epicentres in Washington State USA, near Panama, and near Ecuador, as plotted by the US Geological Survey.
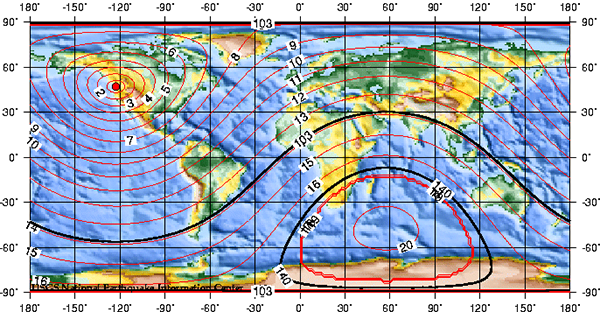
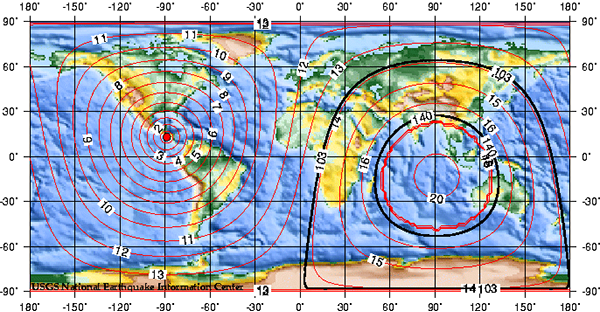

These maps are shown on an equirectangular map projection, which of course distorts the shape of the surface of the Earth (as discussed in 14: Map projections). To get a better idea of how the seismic waves propagate, we need to project these maps onto a sphere.
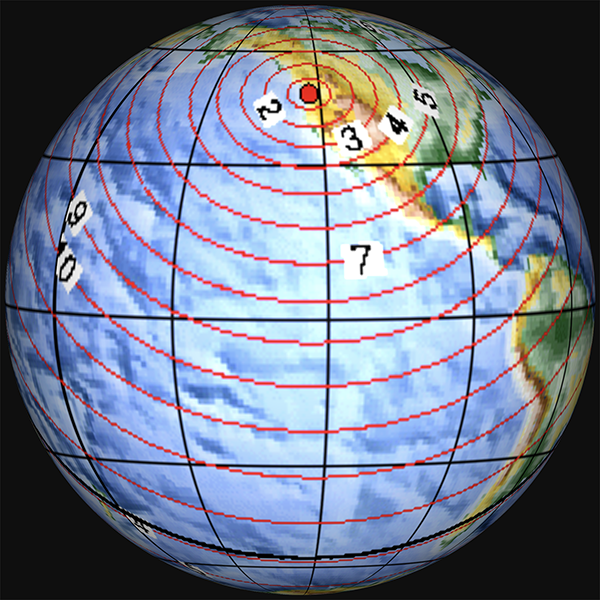
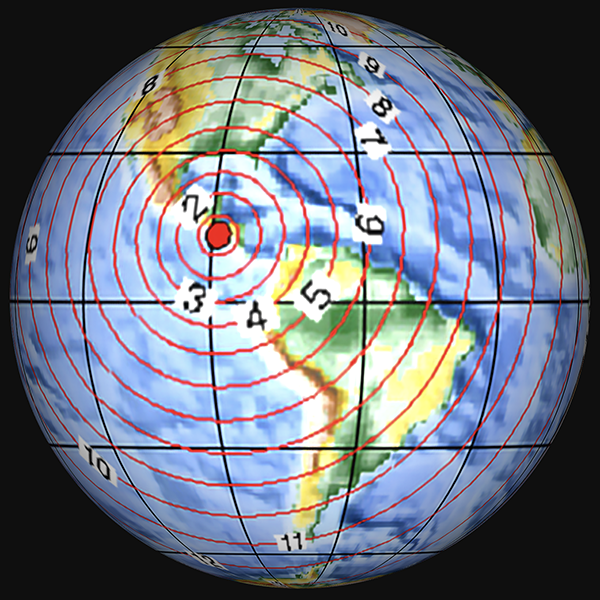

In these projections, you can see that the seismic wave travel time isochrones are circles, spreading out around the globe from the epicentres.
At least, the waves spread out in circles on a spherical Earth. In a flat Earth model, such as the typical “north pole in the middle” one, the spread of seismic waves produces elongated elliptical shapes or kidney shapes (such as the ones drawn in 23: Straight line travel), for no apparent or explicable reason.
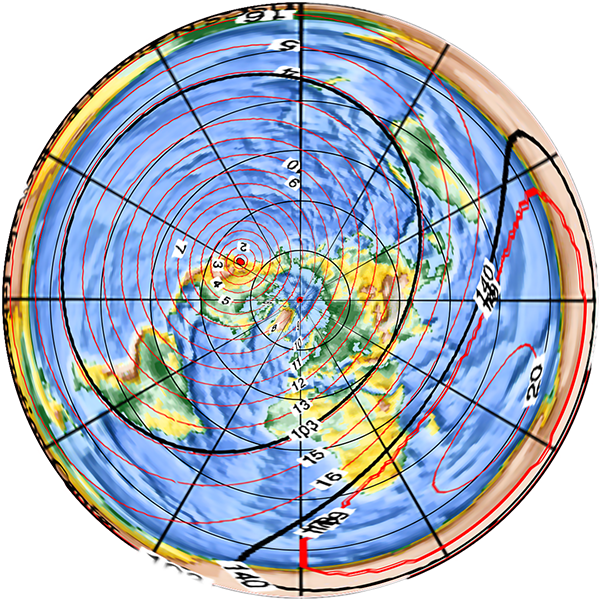
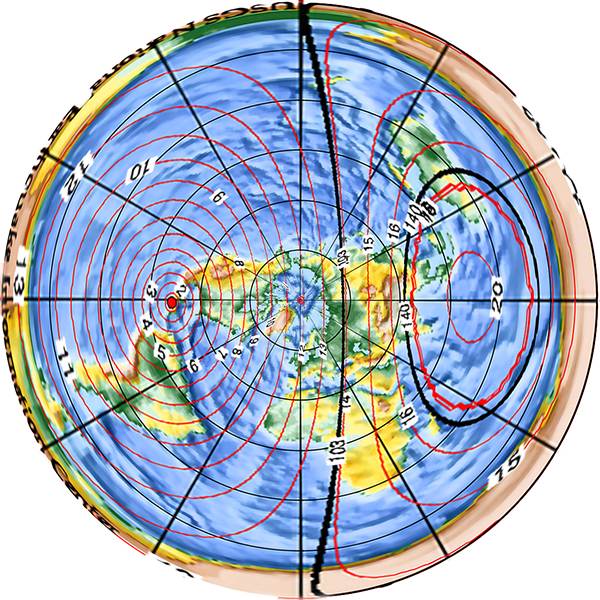

Why should seismic waves propagate more slowly towards or away from the North Pole, and faster along tangential arcs? Why would they take longer to reach an area in the middle of the opposing half of the disc than to reach the far edge of the disc, which is further away? There is no a priori reason, and any proposed justification is yet another ad hoc bandage on the model.
So the propagation speeds of the various seismic waves and the travel times to recording stations provide another proof that the Earth is a globe.
Note: There is more to be said about the propagation of seismic waves, which will provide another, different proof that the Earth is a globe. Some readers no doubt have a good idea what it is already. Rest assured that I haven’t overlooked it, and it will be covered in detail in a future article.
References:
[1] Athanasopoulos, G., Pelekis, P., Anagnostopoulos, G. A. “Effect of soil stiffness in the attenuation of Rayleigh-wave motions from field measurements”, Soil Dynamics and Earthquake Engineering, 19, p. 277-288, 2000. https://doi.org/10.1016/S0267-7261(00)00009-9
[2] Quang, P. B., Gaillard, P., Cano, Y. “Association of array processing and statistical modelling for seismic event monitoring”, Proceedings of the 23rd European Signal Processing Conference (EUSIPCO 2015), p. 1945-1949, 2015. https://doi.org/10.1109/EUSIPCO.2015.7362723
[3] International Seismological Centre (2020), International Seismograph Station Registry (IR). https://doi.org/10.31905/EL3FQQ40
