40. Falling objects

What could be more simple than dropping an object and watching it fall to the ground? Our everyday experience shows that if you drop something, it falls straight down.

The Ancient Greek philosopher Aristotle used this observation to show that the Earth cannot possibly be moving or rotating. If the Earth were rotating from west to east, as some rival philosophers argued, then when you drop something, the Earth will move eastwards underneath it as it falls, and the object should land some distance west of where you dropped it! We don’t see this happening, ergo, the Earth cannot possibly be moving. Q.E.D.

Aristotle of course got many things wrong in his proposed system of the mechanics of motion and how the cosmos worked – a system known now as Aristotelian physics. Among his other contentions were that heavier objects fall faster than lighter ones, and that an object cannot undergo “unnatural motion” unless acted on by a force (falling is a “natural motion” and therefore requires no force).

One consequence of strict Aristotelian physics is that as soon as an object is released, it can have no sideways motion, and must fall straight down. This is obviously false if you observe objects such as arrows or cannonballs in flight, and natural philosophers of the Middle Ages developed the concept of impetus to explain this. The basic idea is that when a force propels an object, it implants in that object an impetus, which acts as an inherent force within the object itself, pushing it onwards. The concept took several centuries to mature, and was formalised by the French philosopher Jean Buridan in the 14th century (perhaps more famous for Buridan’s ass, which was not his backside, but a philosophical paradox).

Archer firing an arrow

An arrow fired by an archer. The arrow does not drop straight to the ground as soon as it leaves the bow, contrary to Aristotelian physics. (Public domain image from Wikimedia Commons.)

Impetus is a forerunner of how Isaac Newton eventually solved the problem, with his idea of momentum and his Laws of Motion. Newton’s First Law says that an object at rest, or in a state of uniform motion, maintains that state unless acted on by an external force. So an object like an arrow that is fired from a bow at some speed maintains that speed unless acted on by external forces. In practice there are two forces acting on a flying arrow: air resistance, which slows down its horizontal motion, and gravity (another of Newton’s cool ideas), which causes it to begin falling towards the ground. The combination of these two results in the arrow slowing down and dropping in altitude, until eventually it hits something (either a target or the ground).

Newton’s First Law also explains why a dropped object falls straight to the ground, instead of falling to the west as the Earth rotates beneath it. An object held in your hand has the same rotational velocity as the Earth at the point where you’re standing. For example, if you’re on the equator, the rotational speed of the Earth’s surface is about 460 metres per second, so you and anything you’re holding, are moving eastwards at that speed. When you let the object go, it continues moving at 460 m/s eastward as it falls – the same speed as the Earth is moving. And so it falls at your feet, what appears to be directly downwards to you, with no sideways deflection.

Or does it?

Dropping a tennis ball

Dropping a tennis ball. Where does it land? (Creative Commons Attribution 2.0 image by Marco Verch, from Flickr.)

If the Earth were flat and non-rotating, then none of this would be an issue. Objects dropped fall downwards and the non-motion of the Earth doesn’t change anything. You don’t even need Newton’s First Law.

If the Earth were flat and rotating like a record (or optical disc) about a central North Pole, things get a little more complicated. Let’s say the equator is 10,000 km from the North Pole (the same as on our Earth), and the Flat Earth rotates once per 24 hours. Then points on the equator are moving with a speed of 2π×10000/(24×60×60) km/s = 727 m/s (faster than our spherical Earth because the geometry is different). If you drop an object (and believe Newton’s laws), the object is moving east at 727 m/s and maintains that motion in a straight line as it falls. Let’s say you drop it from a height of 2 metres. It takes 0.64 seconds to hit the ground. In 0.64 seconds, the object moves east a distance of 465 metres. The ground is also moving east at 727 m/s, however, the ground is not moving in a straight line – it’s moving in a circle about the North Pole. In 0.64 seconds the ground moves through an angle of 0.0027°. Doing the trigonometry, this means the ground moves 465×cos(0.0027°) m east (which is slightly less than, but so close to 465 m that it’s not worth writing the difference) and 465×sin(0.0027°) m north, which equals 0.022 metres. So, if we live on a rotating Flat Earth, and you drop an object from 2 metres height at the equator, you should see it land 22 millimetres south of straight down.

Dropping objects on a rotating flat Earth

On a rotating Flat Earth, if you drop an object on the equator (green dot, left), both the Earth and the object at that point are moving west to east. As the object falls, the Earth rotates (right). The location on the Earth where you dropped the object moves in a circle (green dot), but the falling object moves in a straight line and lands at the red dot, south of the starting location.

This is a prediction of the rotating Flat Earth model. Repeating the above calculations for different latitudes (assuming distances from the North Pole equal to our round Earth), we would expect a southward deflection of 11 mm at 45° north, or 33 mm at 45° south. Do we observe such a southward deflection of falling objects? No, we don’t.

Now let’s think about our spherical Earth, because things are not quite as straightforward as they might appear. The equator is rotating at a speed of 460 m/s. It’s not moving in a straight line – it’s rotating about the Earth’s axis, once every sidereal day: T = 23 hours, 56 minutes, 4 seconds (see 36. The visible stars). The radius of rotation is the equatorial radius of the Earth: 6378.1 km. If you hold an object 2 metres above the ground, its radius of rotation is 2 metres larger, making the distance it has to travel in a sidereal day 4π metres larger. So the speed of rotation 2 metres above the ground is 4π/T = 0.000145 m/s faster than the ground. In 0.46 seconds, this means that an object 2 metres above the ground moves eastward by 0.067 millimetres greater distance than the ground does.

So if you stand on the equator and drop an object from 2 metres, it should land 0.067 mm east of straight down. If you increase the height and drop an object from 100 metres, it takes 4.52 seconds to fall and by this calculation should land 33 mm east of straight down. The German language Wikipedia has an article on this calculation (there is no English Wikipedia article on it), and derives the same result, but then it says that “a more precise calculation” produces an additional factor 2/3, citing Carl Friedrich Gauss’s collected works without any further explanation. So this gives a deflection of 22 mm for an object dropped from 100 m. There is also an adjustment for latitude, being the usual cosine(latitude) term that we have seen in many of these discussions.

This is a prediction of the rotating spherical Earth model. Do we observe such an eastward deflection of falling objects?

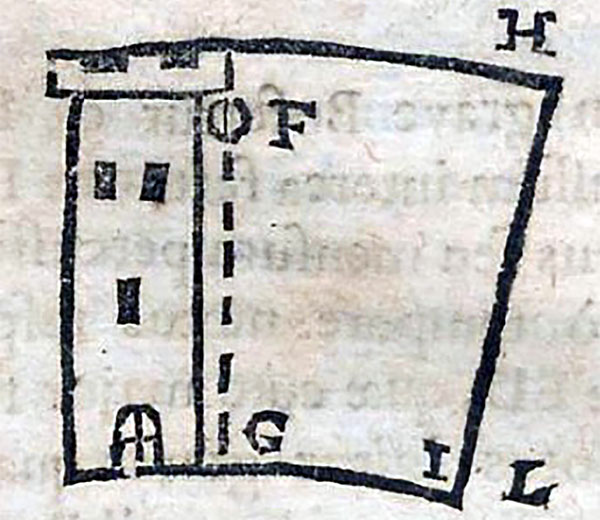
There is in fact a long history of scientists investigating this effect and trying to measure it. In 1674, the French Jesuit priest and mathematician Claude François Milliet Dechales published his Cursus seu Mondus Matematicus, which included a diagram showing the fall of an object from a tower on the rotating Earth. It’s not clear if he ever performed the experiment.

Diagram of dropping object from a tower

Diagram from Dechales’s Cursus seu Mondus Matematicus showing an object F falling from a tower FG. As the Earth rotates the tower FG moves to HI, but the object does not land at I, it lands further east at L. (Public domain image from Wikimedia Commons.)

Isaac Newton himself wrote about the effect in a letter to Robert Hooke, dated 28 November, 1679, just five years later[2].

Newton's letter to Robert Hooke

Newton’s letter of 28 November 1679 to Robert Hooke. Larger version. (Pages reproduced from [2].)

In the letter, Newton drew a diagram of an object falling, not just from a height to the ground, but continuing to fall towards the centre of the Earth (as if the object could pass through the Earth):
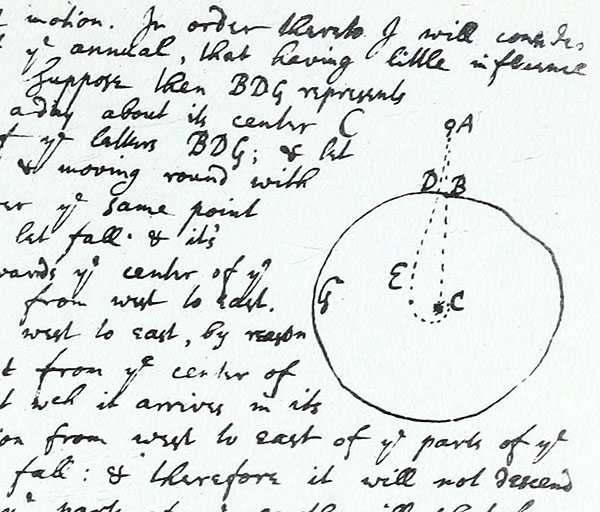
Diagram from Newton's letter

Enlargement of the diagram from Newton’s letter.

In the text accompanying the diagram Newton writes:

Then imagine this body be let fall and its gravity will give it a new motion towards the centre of the Earth without diminishing the previous one from west to east. Whence the motion of this body from west to east, by respect that before its fall it was more distant from the centre of the Earth than the parts of the Earth at which it arrives in its fall, will be greater than the motion from west to east of parts of the Earth at which the body arrives in its fall, and therefore it will not descend the perpendicular AC, but outrunning the parts of the Earth will shoot forward to the east side of the perpendicular, describing in its fall a spiral line ADEC.

Newton goes on to suggest that a “descent of but 20 to 30 yards” may be enough to observe the eastward deflection. Being a theoretician, Newton doesn’t seem to have done the experiment, but Hooke tried to measure the eastward deflection of an object falling from a height of 8.2 metres. From this height the expected deflection is about a quarter of a millimetre at the latitude of London—very difficult to measure—and Hooke’s results were inconclusive.

The first positive result was achieved in 1791 by Italian scientist Giovanni Battista Guglielmini. He dropped a total of 16 balls from the top of the Asinelli Tower of Bologna, a height of 78 m, comparing the landing positions to a vertical defined by a plumb-bob line. He concluded that the average eastward deflection of the balls was about 18 mm, compared to a predicted deflection of 11 mm.[3] Of course, these early experiments faced many difficulties, such as air currents, the difficulty of releasing the balls without any sideways motion, and measuring a vertical plumb line accurately.

In 1802, Johann Benzenberg dropped 32 balls from the tower of St Michael’s Church in Hamburg, 76 m high. Being at a higher latitude than Bologna, the expected eastward deflection was 8.7 mm, and Benzenberg recorded an average value of 9 mm. In 1831, Ferdinand Reich dropped lead balls 158  metres down the Drei Brüders (Three Brothers) mine shaft near Freiberg, measuring 28 mm eastward deflection, with a predicted value of 29.4 mm. In 1902 Edwin Hall performed the experiment with 948 separate drops from a height of 23 m at Harvard University, measuring an eastward deflection of 1.5 mm, compared to the predicted 1.8 mm. And Camille Flammarion dropped 144 balls from 68 m in the Pantheon in Paris, measuring a deflection of 6.3 mm, compared to the theoretical 8.1 mm.[3]

This is not an easy experiment to perform with sufficient accuracy. It is sensitive to a lot of complicating factors, particularly air currents, but the overall agreement of observation with the predictions is good. And so the measurable eastward deflection of falling objects provides us with another proof that the Earth is a (rotating) globe.

Note: I’ve talked only about the eastward deflection of falling objects. There is also a smaller predicted deflection in the north-south direction for latitudes away from the equator. That will be discussed in a future Proof.

References:

[1] Dechales, C. F. M. Cursus seu mundus mathematicus (Vol. 1), 1674.

[2] Gunther, R. T. Early Science in Oxford, Volume X, Oxford University Press, Oxford, 1920-1937. https://archive.org/details/earlyscienceinox10gunt/page/52/mode/2up

[3] Tiersten, M., Soodak, H. “Dropped objects and other motions relative to the noninertial earth”. American Journal of Physics, 68, p. 129-142, 2000. https://doi.org/10.1119/1.19385

35. The Eötvös effect

In the opening years of the twentieth century, scientists in the field of geodesy (measuring the shape and gravitational field of the Earth) were interested in making measurements of the strength of gravity all over the Earth’s surface. To do this, they trekked to remote regions of the world with sensitive gravimeters, to take the readings. On land this was straightforward enough, but they also wanted measurements taken at sea.

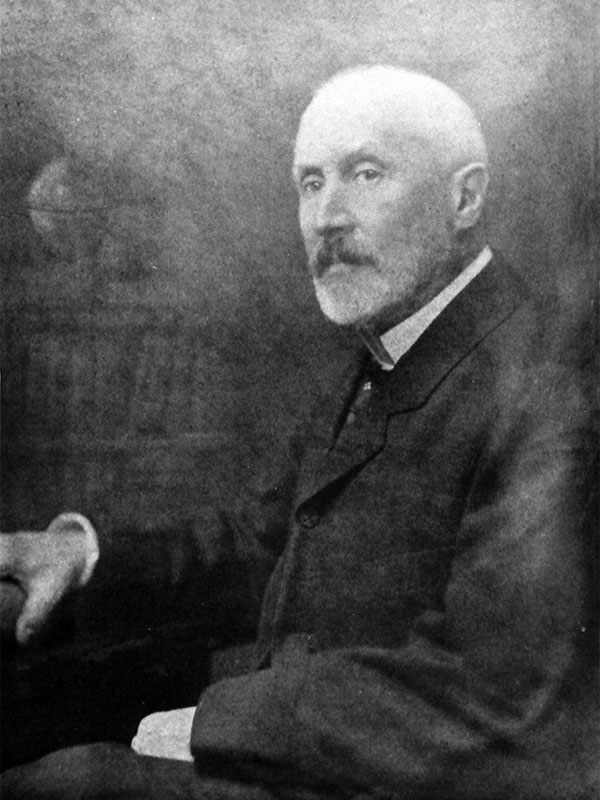
Around 1900, teams from the Institute of Geodesy in Potsdam took voyages into the Atlantic, Indian, and Pacific Oceans on ships, and made measurements using their gravimeters. The collected data were brought back to Potsdam for analysis. There, the readings fell under the scrutinising eyes of the Hungarian physicist Loránd Eötvös, who specialised in studying the variation of Earth’s gravitational field with position on the surface. He noticed an odd thing about the readings.

Loránd Eötvös

Because of the impracticality of stopping the ship every time they wanted to take a reading, the scientists measured the Earth’s gravity while the ships were moving. There was no reason to suppose this would make any difference. But Eötvös found a systematic effect. Gravity measurements taken while the ship was moving eastward were lower than readings taken while the ship was moving westward.

Eötvös realised that this effect was being caused by the rotation of the Earth. The Earth’s equatorial circumference is 40,075 km, and it rotates eastward once every sidereal day (23 hours, 56 minutes). So the ground at the equator is rotating at a linear speed of 465 metres per second. To move in a circular path rather than a straight line (as dictated by Newton’s First Law of Motion), gravity supplies a centripetal force to any object on the Earth’s surface. The necessary force is equal to the object’s mass times the velocity squared, divided by the radius of the circular path (6378 km). This comes to m×4652/6378000 = 0.0339m. So per kilogram of mass, a force of 0.0339 newtons is needed to enforce the circular path, an amount easily supplied by the Earth’s gravity. (This is why objects don’t get flung off the Earth by its rotation, a complaint of some spherical Earth sceptics.)

What this means is that the effective acceleration due to gravity measured for an object sitting on the equator is reduced by 0.0339 m/s2 (the same units as 0.0339 N/kg) compared to if the Earth were not rotating. But if you’re on a ship travelling east at, say, 10 m/s, the centripetal force required to keep you on the Earth’s surface is greater, equal to 4752/6378000 = 0.0354 N/kg. This reduces the apparent measured gravity by a larger amount, making the measured value of gravity smaller. And if you’re on a ship travelling west at 10 m/s, the centripetal force is 4552/6378000 = 0.0324 N/kg, reducing the apparent gravity by a smaller amount and making the measured value of gravity greater. The difference in apparent gravity between the ships travelling east and west is 0.003 m/s2, which is about 0.03% of the acceleration due to gravity. For a person of mass 70 kg, this is a difference in apparent weight of about 20 grams (strictly speaking, a difference in weight of 0.2 newtons, which is 20 grams multiplied by acceleration due to gravity).

Eötvös set out these theoretical calculations, and then organised an expedition to measure and test his results. In 1908, the experiment was carried out on board a ship in the Black Sea, with two separate ships travelling east and west past one another so the measurements could be made at the same time. The results matched Eötvös’s predictions, thus confirming the effect.

In general (if you’re not at the equator), your linear speed caused by the rotation of the Earth is equal to 465 m/s times the cosine of your latitude, while the radius of your circular motion is also equal to 6378 km times the cosine of your latitude. The centripetal force formula uses the square of the velocity divided by the radius, so this results in a cosine(latitude) term in the final result. That is, the size of the Eötvös effect also varies as the cosine of the latitude. If you measure it at 60° latitude, either north or south, the difference in gravity between east and west travelling ships is half that measured at the equator.

The Eötvös effect is well known in the field of gravimetry, and is routinely corrected for when taking measurements of the Earth’s gravitational strength from moving ships[1], aircraft[2], or submarines[3]. The reference on submarines refers to a gravitational measurement module for use on military submarines to enhance their navigation capability as undersea instruments of warfare. This module includes an Eötvös effect correction for when the sub is moving east or west. You can bet your bottom dollar that no military force in the world would make such a correction to their navigation instruments if it weren’t necessary.

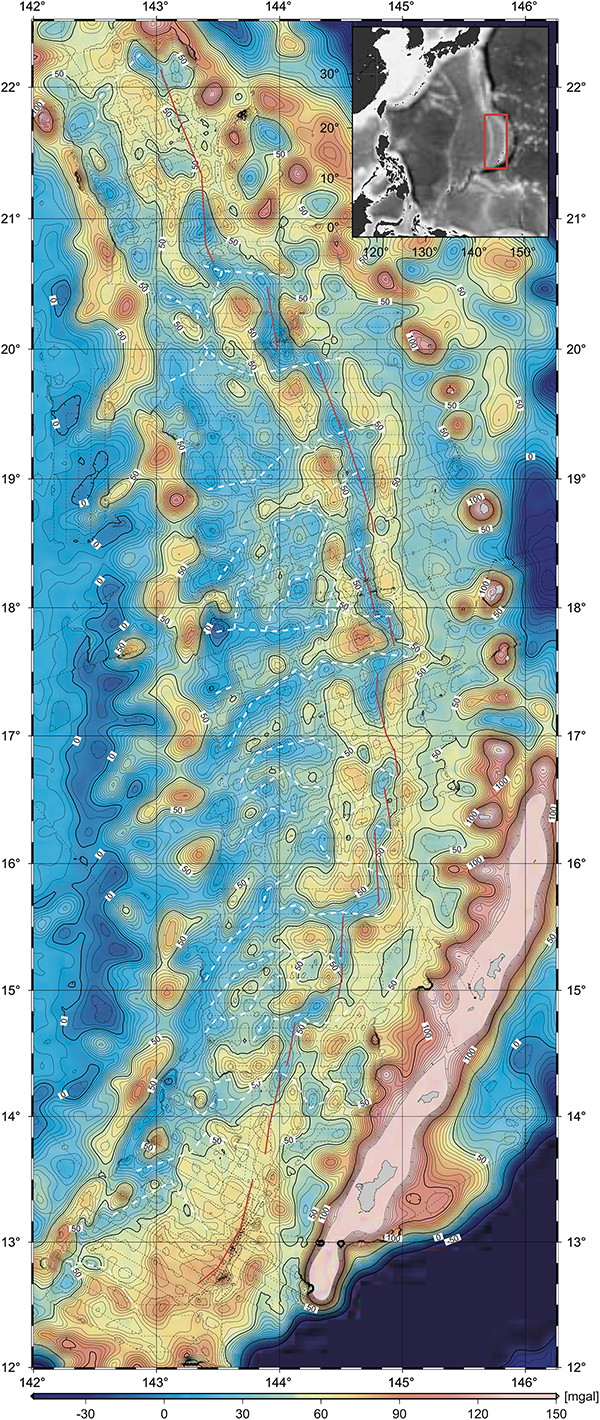
One paper I found reports measurements made of the detailed structure of gravitational anomalies over the Mariana Trough in the Pacific Ocean south of Japan. It states:

Shipboard free-air gravity anomalies were calculated by subtracting the normal gravity field data from observed gravity field data, with a correction applied for the Eötvös effect using Differential Global Positioning System (DGPS) data.[4]

The results look pretty cool:

Mariana Trough gravity anomalies map

Map of gravitational anomalies in the Mariana Trough region of the Pacific Ocean, as obtained by shipboard measurement, corrected for the Eötvös effect. (Figure reproduced from [4].)

Another paper shows the Eötvös effect more directly:

Gravity measurements from moving ship

Graph showing measurements of Earth’s gravitational field strength versus distance travelled by a ship in the South Indian Ocean. In the leftmost section (16), the ship is moving slowly westward. In the central section (17) the ship is moving at a faster speed westward, showing the increase in measured gravity. In the right section (18) the ship is moving eastward at slow speed, and the gravity readings are lower than the readings taken in similar positions while moving westward. (Figure reproduced from [5].)

If the Earth were flat, on the other hand, there would be no Eötvös effect at all. If the flat Earth is not rotating (as most models posit, with the sun moving above it in a circular path), obviously there is no centripetal acceleration happening at all. Even if you adopt a model where the flat Earth rotates about the North Pole, the centripetal acceleration at every point on the surface is parallel to the surface, towards the pole, not directed downwards. So an Eötvös-like effect would actually cause a slight deflection in the angle of gravity, but almost zero change in the magnitude of the gravity.

The Eötvös effect shows that not only is the Earth rotating, but that it is rotating about a central point that is underneath the ground, not somewhere on the surface. If you stand on the equator and face east, the surface of the Earth is rotating in the direction you are facing and downwards, not to the left or right. Furthermore, the cosine term shows that at equal latitudes both north and south, the rotation is at the same angle relative to the surface, which can only be the case if the Earth is symmetrical about the equator: i.e. spherical.

References:

[1] Rousset, D., Bonneville, A., Lenat, J.F. “Detailed gravity study of the offshore structure of Piton de la Fournaise volcano, Réunion Island”. Bulletin of Volcanology, 49(6), p. 713-722, 1987. https://doi.org/10.1007/BF01079822

[2] Thompson, L.G., LaCoste, L.J. “Aerial gravity measurements”. Journal of Geophysical Research, 65(1), p. 305-322, 1960. https://doi.org/10.1029/JZ065i001p00305

[3] Moryl, J., Rice, H., Shinners, S. “The universal gravity module for enhanced submarine navigation”. In IEEE 1998 Position Location and Navigation Symposium, p. 324-331, April 1996. https://doi.org/10.1109/PLANS.1998.670124

[4] Kitada, K., Seama, N., Yamazaki, T., Nogi, Y., Suyehiro, K., “Distinct regional differences in crustal thickness along the axis of the Mariana Trough, inferred from gravity anomalies”. Geochemistry, Geophysics, Geosystems, 7(4), 2006. https://doi.org/10.1029/2005GC001119

[5] Persson, A. “The Coriolis Effect: Four centuries of conflict between common sense and mathematics, Part I: A history to 1885”. History of Meteorology, 2, p.1-24, 2005. https://www.semanticscholar.org/paper/The-Coriolis-Effect%3A-Four-centuries-of-conflict-and-Persson/c9e72567af65e44384fba048bbf491d3ac3a30ff

27. Camera image stabilisation

Cameras are devices for capturing photographic images. A camera is basically a box with an opening in one wall that lets light enter the box and form an image on the opposite wall. The earliest such “cameras” were what are now known as camera obscuras, which are closed rooms with a small hole in one wall. The name “camera obscura” comes from Latin: “camera” meaning “room” and “obscura” meaning “dark”. (Which is incidentally why in English “camera” refers to a photographic device, while in Italian “camera” means a room.)

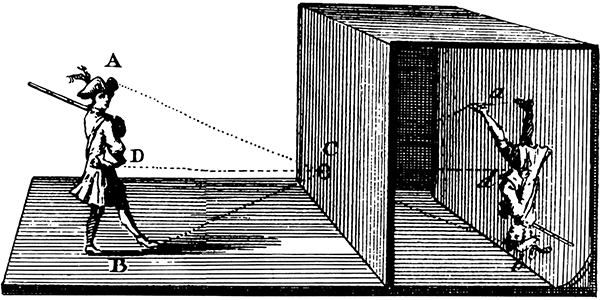
A camera obscura works on the principle that light travels in straight lines. How it forms an image is easiest to see with reference to a diagram:

Camera obscura diagram

Diagram illustrating the principle of a camera obscura. (Public domain image from Wikimedia Commons.)

In the diagram, the room on the right is enclosed and light can only enter through the hole C. Light from the head region A of a person standing outside enters the hole C, travelling in a straight line, until it hits the far wall of the room near the floor. Light from the person’s feet B travels through the hole C and ends up hitting the far wall near the ceiling. Light from the person’s torso D hits the far wall somewhere in between. We can see that all of the light from the person that enters through the hole C ends up projected on the far wall in such a way that it creates an image of the person, upside down. The image is faint, so the room needs to be dark in order to see it.

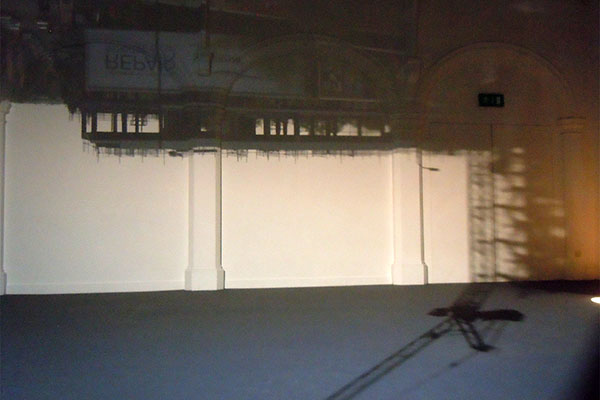
If you have a modern photographic camera, you can expose it for a long time to capture a photo of the faint projected image inside the room (which is upside down).

Camera obscura photo

A room turned into a camera obscura, at the Camden Arts Centre, London. (Creative Commons Attribution 2.0 image by Flickr user Kevan, from Flickr.)

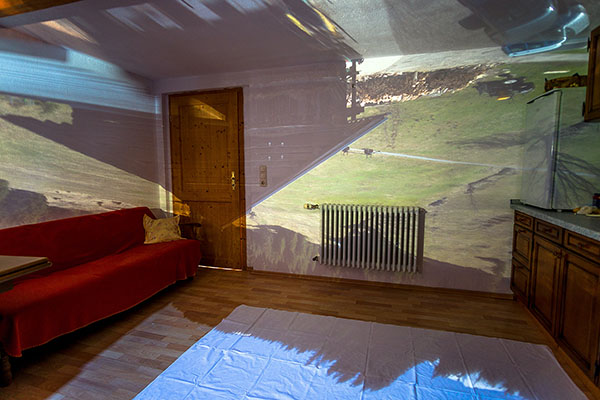
The hole in the wall needs to be small to keep the image reasonably sharp. If the hole is large, the rays of light from a single point in the scene outside project to multiple points on the far wall, making the image blurry – the larger the hole, the brighter the image, but blurrier it is. You can overcome this by placing a lens in the hole, which focuses the incoming light back down to a sharper focus on the wall.

Camera obscura photo

Camera obscura using a lens to focus the incoming light for a brighter, sharper image. (Creative Commons Attribution 2.0 image by Flickr user Willi Winzig, from Flickr.)

A photographic camera is essentially a small, portable camera obscura, using a lens to focus an image of the outside world onto the inside of the back of the camera. The critical difference is that where the image forms on the back wall, there is some sort of light-sensitive device that records the pattern of light, shadow, and colour. The first cameras used light-sensitive chemicals, coated onto a flat surface. The light causes chemical reactions that change physical properties of the chemicals, such as hardness or colour. Various processes can then be used to convert the chemically coated surface into an image, that more or less resembles the scene that was projected into the camera. Modern chemical photography uses film as the chemical support medium, but glass was popular in the past and is still used for specialty purposes today.

More recently, photographic film has been largely displaced by digital electronic light sensors. Sensor manufacturers make silicon chips that contain millions of tiny individual light sensors arranged in a rectangular grid pattern. Each one records the amount of light that hits it, and that information is recorded as one pixel in a digital image file – the file holding millions of pixels that encode the image.

Camera cross section

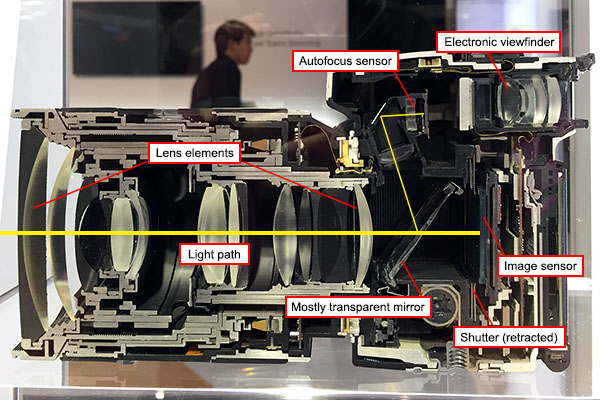
Cross section of a modern camera, showing the light path through the lens to the digital image sensor. In this camera, a partially silvered fixed mirror reflects a fraction of the light to a dedicated autofocus sensor, and the viewfinder is electronic (this is not a single-lens reflex (SLR) design). (Photo by me.)

One important parameter in photography is the exposure time (also known as “shutter speed”). The hole where the light enters is covered by a shutter, which opens when you press the camera button, and closes a little bit later, the amount of time controlled by the camera settings. The longer you leave open the shutter, the more light can be collected and the brighter the resulting image is. In bright sunlight you might only need to expose the camera for a thousandth of a second or less. In dimmer conditions, such as indoors, or at night, you need to leave the shutter open for longer, sometimes up to several seconds to make a satisfactory image.

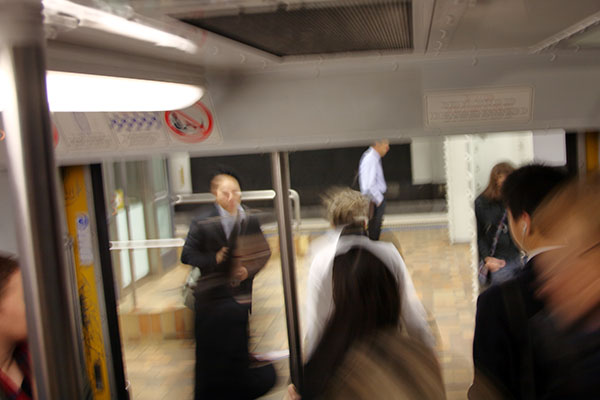
A problem is that people are not good at holding a camera still for more than a fraction of a second. Our hands shake by small amounts which, while insignificant for most things, are large enough to cause a long exposure photograph to be blurry because the camera points in slightly different directions during the exposure. Photographers use a rule of thumb to determine the longest shutter speed that can safely be used: For a standard 35 mm SLR camera, take the reciprocal of the focal length of the lens in millimetres, and that is the longest usable shutter speed for hand-held photography. For example, when shooting with a 50 mm lens, your exposure should be 1/50 second or less to avoid blur caused by hand shake. Longer exposures will tend to be blurry.

Camera shake

A photo I took with a long exposure (0.3 seconds) on a (stationary) train. Besides the movement of the people, the background is also blurred by the shaking of my hands; the signs above the door are blurred to illegibility.

The traditional solution has been to use a tripod to hold the camera still while taking a photo, but most people don’t want to carry around a tripod. Since the mid-1990s, another solution has become available: image stabilisation. Image stabilisation uses technology to mitigate or undo the effects of hand shake during image capture. There are two types of image stabilisation:

1. Optical image stabilisation was the first type invented. The basic principle is to move certain optical components of the camera to compensate for the shaking of the camera body, maintaining the image on the same location on the sensor. Gyroscopes are used to measure the tilting of the camera body caused by hand shake, and servo motors physically move the lens elements or the image sensor (or both) to compensate. The motions are very small, but crucial, because the size of a pixel on a modern camera sensor is only a few micrometres, so if the image moves more than a few micrometres it will become blurry.

Image stabilised photo

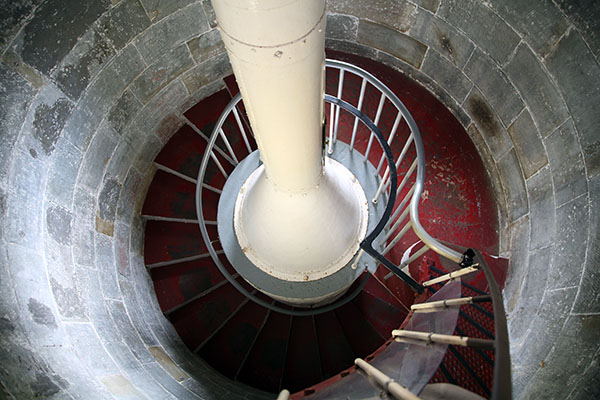
Optically image stabilised photo of a dim lighthouse interior. The exposure is 0.5 seconds, even longer than the previous photo, but the image stabilisation system mitigates the effects of hand shake, and details in the photo remain relatively unblurred. (Photo by me.)

2. Digital image stabilisation is a newer technology, which relies on image processing, rather than moving physical components in the camera. Digital image processing can go some way to remove the blur from an image, but this is never a perfect process because blurring loses some of the information irretrievably. Another approach is to capture multiple shorter exposure images and combine them after exposure. This produces a composite longer exposure, but each sub-image can be shifted slightly to compensate for any motion of the camera before adding them together. Although digital image stabilisation is fascinating, for this article we are actually concerned with optical image stabilisation, so I’ll say no more about digital.

Early optical image stabilisation hardware could stabilise an image by about 2 to 3 stops of exposure. A “stop” is a term referring to an increase or decrease in exposure by a factor of 2. With 3 stops of image stabilisation, you can safely increase your exposure by a factor of 23 = 8. So if using a 50 mm lens, rather than need an exposure of 1/50 second or less, you can get away with about 1/6 second or less, a significant improvement.

Image stabilisation system diagram

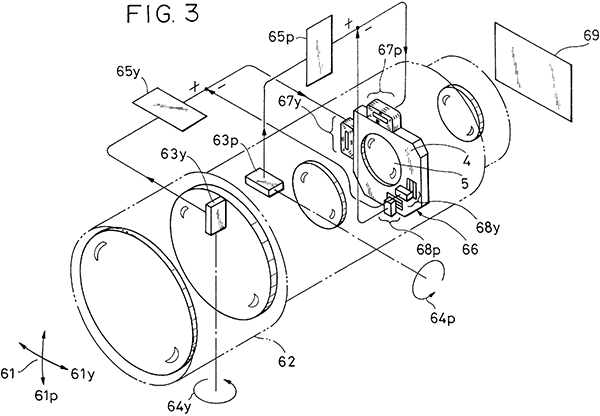
Optical image stabilisation system diagram from a US patent by Canon. The symbols p and y refer to pitch and yaw, which are rotations as defined by the axes shown at 61. 63p and 63y are pitch and yaw sensors (i.e. gyroscopes), which send signals to electronics (65p and 65y) to control actuator motors (67p and 67y) to move the lens element 5, in order to keep the image steady on the sensor 69. 68p and 68y are position feedback sensors. (Figure reproduced from [1].)

Newer technology has improved optical image stabilisation to about 6.5 stops. This gives a factor of 26.5 = 91 times improvement, so that 1/50 second exposure can now be stretched to almost 2 seconds without blurring. Will we soon see further improvements giving even more stops of optical stabilisation?

Interestingly, the answer is no. At least not without a fundamentally different technology. According to an interview with Setsuya Kataoka, Deputy Division Manager of the Imaging Product Development Division of Olympus Corporation, 6.5 stops is the theoretical upper limit of gyroscope-based optical image stabilisation. Why? In his words[2]:

6.5 stops is actually a theoretical limitation at the moment due to rotation of the earth interfering with gyro sensors.

Wait, what?

This is a professional camera engineer, saying that it’s not possible to further improve camera image stabilisation technology because of the rotation of the Earth. Let’s examine why that might be.

As calculated above, when we’re in the realm of 6.5 stops of image stabilisation, a typical exposure is going to be of the order of a second or so. The gyroscopes inside the camera are attempting to keep the camera’s optical system effectively stationary, compensating for the photographer’s shaky hands. However, in one second the Earth rotates by an angle of 0.0042° (equal to 360° divided by the sidereal rotation period of the Earth, 86164 seconds). And gyroscopes hold their position in an inertial frame, not in the rotating frame of the Earth. So if the camera is optically locked to the angle of the gyroscope at the start of the exposure, one second later it will be out by an angle of 0.0042°. So what?

Well, a typical digital camera sensor contains pixels of the order of 5 μm across. With a focal length of 50 mm, a pixel subtends an angle of 5/50000×(180/π) = 0.006°. That’s very close to the same angle. In fact if we change to a focal length of 70 mm (roughly the border between a standard and telephoto lens, so very reasonable for consumer cameras), the angles come out virtually the same.

What this means is that if we take a 1 second exposure with a 70 mm lens (or a 2 second exposure with a 35 mm lens, and so on), with an optically stabilised camera system that perfectly locks onto a gyroscopic stabilisation system, the rotation of the Earth will cause the image to drift by a full pixel on the image sensor. In other words, the image will become blurred. This theoretical limit to the performance of optical image stabilisation, as conceded by professional camera engineers, demonstrates that the Earth is rotating once per day.

To tie this in to our theme of comparing to a flat Earth, I’ll concede that this current limitation would also occur if the flat Earth rotated once per day. However, the majority of flat Earth models deny that the Earth rotates, preferring the cycle of day and night to be generated by the motion of a relatively small, near sun. The current engineering limitations of camera optical image stabilisation rule out the non-rotating flat Earth model.

You could in theory compensate for the angular error caused by Earth rotation, but to do that you’d need to know which direction your camera was pointing relative to the Earth’s rotation axis. Photographers hold their cameras in all sorts of orientations, so you can’t assume this; you need to know both the direction of gravity relative to the camera, and your latitude. There are devices which measure these (accelerometers and GPS), so maybe some day soon camera engineers will include data from these to further improve image stabilisation. At that point, the technology will rely on the fact that the Earth is spherical – because the orientation of gravity relative to the rotation axis changes with latitude, whereas on a rotating flat Earth gravity is always at a constant angle to the rotation axis (parallel to it in the simple case of the flat Earth spinning like a CD).

And the fact that your future camera can perform 7+ stops of image stabilisation will depend on the fact that the Earth is a globe.

References:

[1] Toyoda, Y. “Image stabilizer”. US Patent 6064827, filed 1998-05-12, granted 2000-05-16. https://pdfpiw.uspto.gov/.piw?docid=06064827

[2] Westlake, Andy. “Exclusive interview: Setsuya Kataoka of Olympus”. Amateur Photographer, 2016. https://www.amateurphotographer.co.uk/latest/photo-news/exclusive-interview-setsuya-kataoka-olympus-95731 (accessed 2019-09-18).

24. Gravitational acceleration variation

When you drop an object, it falls down. Initially the speed at which it falls is zero, and this speed increases over time as the object falls faster and faster. In other words, objects falling under the influence of gravity are accelerating. It turns out that the rate of acceleration is a constant when the effects of air resistance are negligible. Eventually air resistance provides a balancing force and the speed of fall reaches a limit, known as the terminal velocity.

Ignoring the air resistance part, the constant acceleration caused by gravity on the Earth’s surface is largely the same everywhere on Earth. This is why you feel like you weigh the same amount no matter where you travel (excluding travel into space!). However, there are small but measurable differences in the Earth’s gravity at different locations.

It’s straightforward to measure the strength of the acceleration due to gravity at any point on Earth with a gravity meter. We’ve already met one type of gravity meter during Airy’s coal pit experiment: a pendulum. So the measurements can be made with Georgian era technology. Nowadays, the most accurate measurements of Earth’s gravity are made from space using satellites. NASA’s GRACE satellite, launched in 2002, gave us our best look yet at the details of Earth’s gravitational field.

Being roughly a sphere of roughly uniform density, you’d expect the gravity at the Earth’s surface to be roughly the same everywhere and—roughly speaking—it is. But going one level of detail deeper, we know the Earth is closer to ellipsoidal than spherical, with a bulge around the equator and flattening at the poles. The surface gravity of an ellipsoid requires some nifty triple integrals to calculate, and fortunately someone on Stack Exchange has done the work for us[1].

Given the radii of the Earth, and an average density of 5520 kg/m3, the responder calculates that the acceleration due to gravity at the poles should be 9.8354 m/s2, while the acceleration at the equator should be 9.8289 m/s2. The difference is about 0.07%.

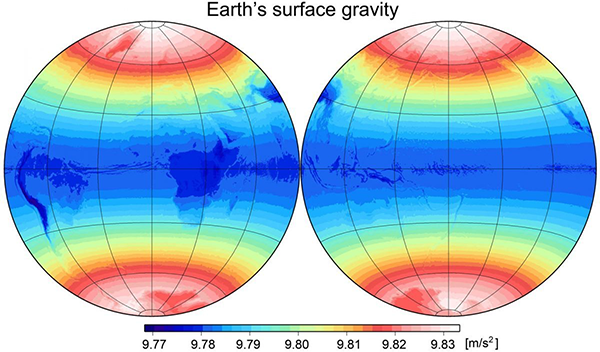
So at this point let’s look at what the Earth’s gravitational field does look like. The following figure shows the strength of gravity at the surface according to the Earth Gravitational Model 2008 (EGM2008), using data from the GRACE satellite.

Earth Gravitational Model 2008

Earth’s surface gravity as measured by NASA’s GRACE and published in the Earth Gravitational Model 2008. (Figure produced by Curtin University’s Western Australian Geodesy Group, using data from [2].)

We can see that the overall characteristic of the surface gravity is that it is minimal at the equator, around 9.78 m/s2, and maximal at the poles, around 9.83 m/s2, with a transition in between. Overlaid on this there are smaller details caused by the continental landmasses. We can see that mountainous areas such as the Andes and Himalayas have lower gravity – because they are further away from the centre of the planet. Now, the numerical value at the poles is a pretty good match for the theoretical value on an ellipsoid, close to 9.835 m/s2. But the equatorial figure isn’t nearly as good a match; the difference between the equator and poles is around 0.6%, not the 0.07% calculated for an ellipsoid of the Earth’s shape.

The extra 0.5% difference comes about because of another effect that I haven’t mentioned yet: the Earth is rotating. The rotational speed at the equator generates a centrifugal pseudo-force that slightly counteracts gravity. This is easy to calculate; it equals the radius times the square of the angular velocity of the surface at the equator, which comes to 0.034 m/s2. Subtracting this from our theoretical equatorial value gives 9.794 m/s2. This is not quite as low as 9.78 seen in the figure, but it’s much closer. I presume that the differences are caused by the assumed average density of Earth used in the original calculation being a tiny bit too high. If we reduce the average density to 5516 kg/m3 (which is still the same as 5520 to three significant figures, so is plausible), our gravities at the poles and equator become 9.828 and 9.788, which together make a better match to the large scale trends in the figure (ignoring the small fluctuations due to landmasses).

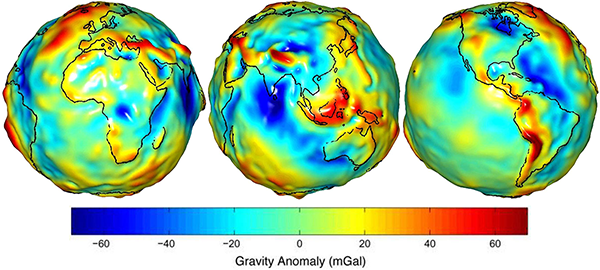
Of course the structure and shape of the Earth are not quite as simple as that of a uniformly dense perfect ellipsoid, so there are some residual differences. But still, this is a remarkably consistent outcome. One final point to note: it took me some time to track down the figure above showing the full value of the Earth’s gravitational field at the surface. When you search for this, most of the maps you find look like the following:

Earth Gravitational Model 2008 residuals

Earth surface gravity residuals, from NASA’s GRACE satellite data. The units are milligals; 1 milligal is equal to 0.00001 m/s2. (Public domain image by NASA, from [3].)

These seem to show that gravity is extremely lumpy across the Earth’s surface, but this is just showing the smaller residual differences after subtracting off a smooth gravity model that includes the relatively large polar/equatorial difference. Given the units of milligals, the largest differences between the red and blue areas shown in this map are only different by a little over 0.001 m/s2 after subtracting the smooth model.

We’re not done yet, because besides Earth we also have detailed gravity mapping for another planet: Mars!

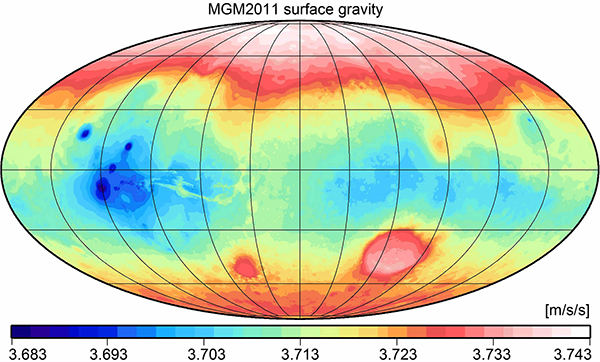
Mars Gravitational Model 2011

Surface gravity strength on Mars. The overall trend is for lowest gravity at the equator, increasing with latitude to highest values at the poles, just like Earth. (Figure reproduced from [4].)

This map shows that the surface gravity on Mars has the same overall shape as that of Earth: highest at the poles and lowest at the equator, as we’d expect for a rotating ellipsoidal planet. Also notice that Mars’s gravity is only around 3.7 m/s2, less than half that of Earth.

Mars’s geography is in some sense much more dramatic than that of Earth, and we can see the smaller scale anomalies caused by the Hellas Basin (large red circle at lower right, which is the lowest point on Mars, hence the higher gravity), Olympus Mons (leftmost blue dot, northern hemisphere, Mars’s highest mountain), and the chain of three volcanoes on the Tharsis Plateau (straddling the equator at left). But overall, the polar/equatorial structure matches that of Earth.

Of course this all makes sense because the Earth is approximately an ellipsoid, differing from a sphere by a small amount of equatorial bulge caused by rotation, as is the case with Mars and other planets. We can easily see that Mars and the other planets are almost spherical globes, by looking at them with a telescope. If the structure of Earth’s gravity is similar to those, it makes sense that the Earth is a globe too. If the Earth were flat, on the other hand, this would be a remarkable coincidence, with no readily apparent explanation for why gravity should be stronger at the poles (remembering that the “south pole” in most flat Earth models is the rim of a disc) and weaker at the equator (half way to the rim of the disc), other than simply saying “that’s just the way Earth’s gravity is.”

References:

[1] “Distribution of Gravitational Force on a non-rotating oblate spheroid”. Stack Exchange: Physics, https://physics.stackexchange.com/questions/144914/distribution-of-gravitational-force-on-a-non-rotating-oblate-spheroid (Accessed 2019-09-06.)

[2] Pavlis, N. K., Holmes, S. A., Kenyon, S. C. , Factor, J. K. “The development and evaluation of the Earth Gravitational Model 2008 (EGM2008)”. Journal of Geophysical Research, 117, p. B04406. https://doi.org/10.1029/2011JB008916

[3] Space Images, Jet Propulsion Laboratory. https://www.jpl.nasa.gov/spaceimages/index.php?search=GRACE&category=Earth (Accessed 2019-09-06.)

[4] Hirt, C., Claessens, S. J., Kuhn, M., Featherstone, W.E. “Kilometer-resolution gravity field of Mars: MGM2011”. Planetary and Space Science, 67(1), p.147-154, 2012. https://doi.org/10.1016/j.pss.2012.02.006

20. Rocket launch sites

Suppose you are planning to build an orbital rocket launching facility. Where are you going to put it? There are several issues to consider.

  • You want the site to be on politically friendly and stable territory. This strongly biases you to building it in your own country, or a dependent territory. Placing it close to an existing military facility is also useful for logistical reasons, especially if any of the space missions are military in nature.
  • You want to build it far enough away from population centres that if something goes catastrophically wrong there will be minimal damage and casualties, but not so far away that it is logistically difficult to move equipment and personnel there.
  • You want to place the site to take advantage of the fact that the rocket begins its journey with the momentum it has from standing on the ground as the Earth rotates. This is essentially a free boost to its launch speed. Since the Earth rotates west to east, the rocket stationary on the pad relative to the Earth actually begins with a significant momentum in an easterly direction. Rocket engineers would be crazy to ignore this.

One consequence of the rocket’s initial momentum is that it’s much easier to launch a rocket towards the east than towards the west. Launching towards the east, you start with some bonus velocity in the same direction, and so your rocket can get away with being less powerful than otherwise. This represents a serious saving in cost and construction difficulty. If you were to launch a rocket towards the west, you’d have to engineer it to be much more powerful, since it first has to overcome its initial eastward velocity, and then generate the entirety of the westward velocity from scratch. So virtually no rockets are ever launched towards the west. Rockets are occasionally launched to the north or south to put their payloads into polar orbits, but most are placed into so-called near-equatorial orbits that travel substantially west-to-east.

In turn, this means that when selecting a launch site, you want to choose a place where the territory to the eastern side of the site is free of population centres, again to avoid disaster if something goes wrong during a launch. The easiest way to achieve this is to place your launch site on the eastern coast of a landmass, so the rockets launch out over the ocean, though you can also do it if you can find a large unpopulated region and place your launch site near the western side.

When we look at the major rocket launch facilities around the world, they generally follow these principles. The Kennedy Space Center at Cape Canaveral is acceptably near Orlando, Florida, but far enough away to avoid disasters, and adjacent to Cape Canaveral Air Force Station for military logistics. It launches east over the Atlantic Ocean.

Kennedy Space Center

Kennedy Space Center launch pads A (foreground) and B (background). The Atlantic Ocean is to the right. (Public domain image by NASA.)

A NASA historical report has this to say about the choice of a launch site for Saturn series rockets that would later take humans to the moon[1]:

The short-lived plan to transport the Saturn by air was prompted by ABMA’s interest in launching a rocket into equatorial orbit from a site near the Equator; Christmas Island in the Central Pacific was a likely choice. Equatorial launch sites offered certain advantages over facilities within the continental United States. A launching due east from a site on the Equator could take advantage of the earth’s maximum rotational velocity (460 meters per second) to achieve orbital speed. The more frequent overhead passage of the orbiting vehicle above an equatorial base would facilitate tracking and communications. Most important, an equatorial launch site would avoid the costly dogleg technique, a prerequisite for placing rockets into equatorial orbit from sites such as Cape Canaveral, Florida (28 degrees north latitude). The necessary correction in the space vehicle’s trajectory could be very expensive – engineers estimated that doglegging a Saturn vehicle into a low-altitude equatorial orbit from Cape Canaveral used enough extra propellant to reduce the payload by as much as 80%. In higher orbits, the penalty was less severe but still involved at least a 20% loss of payload. There were also significant disadvantages to an equatorial launch base: higher construction costs (about 100% greater), logistics problems, and the hazards of setting up an American base on foreign soil.

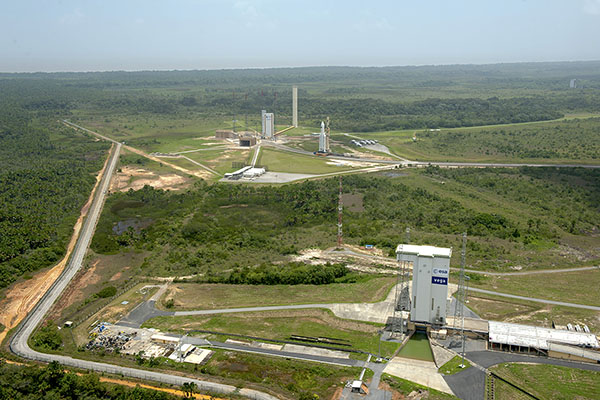
Russia’s main launch facility, Baikonur Cosmodrome in Kazakhstan (former USSR territory), launches east over the largely uninhabited Betpak-Dala desert region. China’s Jiuquan Satellite Launch Centre launches east over the uninhabited Altyn-Tagh mountains. The Guiana Space Centre, the major launch facility of the European Space Agency, is located on the coast of French Guiana, an overseas department of France on the north-east coast of South America, where it launches east over the Atlantic Ocean.

Guiana Space Centre

Guiana Space Centre, French Guiana. The Atlantic Ocean is in the background. (Photo: ESA-Stephane Corvaja, released under ESA Standard Licence.)

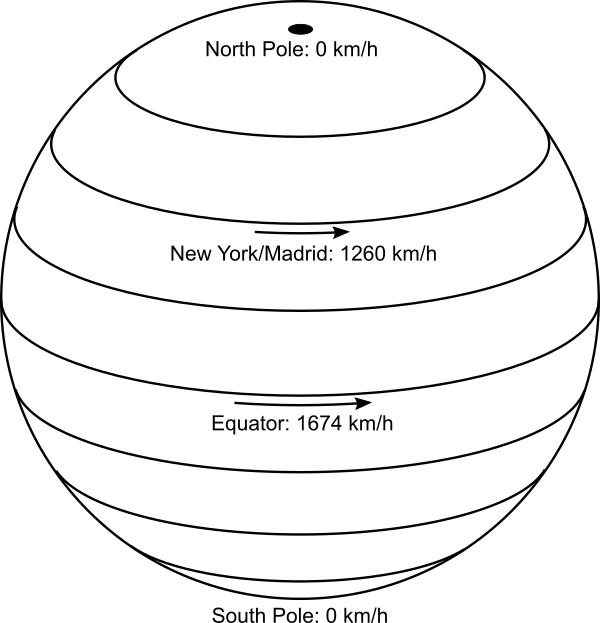
Another consideration when choosing your rocket launching site is that the initial momentum boost provided by the Earth’s rotation is greatest at the equator, where the rotational speed of the Earth’s surface is greatest. At the equator, the surface is moving 40,000 km (the circumference of the Earth) per day, or 1670 km/h. Compare this to latitude 41° (roughly New York City, or Madrid), where the speed is 1260 km/h, and you see that our rockets get a free 400 km/h boost by being launched from the equator compared to these locations. So you want to place your launch facility as close to the equator as is practical, given the other considerations.

Rotation of Earth

Because the Earth is a rotating globe, the equatorial regions are moving faster than anywhere else, and provide more of a boost to rocket launch velocities.

The European Space Agency, in particular, has problems with launching rockets from Europe, because of its dense population, unavailability of an eastern coastline, and distance from the equator. This makes French Guiana much more attractive, even though it’s so far away. The USA has placed its major launch facility in just about the best location possible in the continental US. Anywhere closer to the equator on the east coast is taken up by Miami’s urban sprawl. The former USSR went for southern Kazakhstan as a compromise between getting as far south as possible, and being close enough to Moscow. China’s more southern and coastal regions are much more heavily populated, so they went with a remote inland area (possibly also to help keep it hidden for military reasons).

All of these facilities so far are in the northern hemisphere. There are no major rocket launch facilities in the southern hemisphere, and in fact only two sites from where orbital flight has been achieved: Australia’s Woomera Range Complex, which is a remote air force base chosen historically for military logistical reasons (including nuclear weapons testing as well as rocketry in the wake of World War II), and New Zealand’s Rocket Lab Launch Complex 1, a new private facility for launching small satellites, whose location was governed by the ability to privately acquire and develop land.

But if you were to build a major launch facility in the southern hemisphere, where would you put it?

A major space facility was first proposed for Australia in 1986, with plans for it to be the world’s first commercial spaceport. The proposed site? Near Weipa, on the Cape York Peninsula, essentially as close to the equator as it’s possible to get in Australia.

Site of Weipa in Australia

Site of Weipa in Australia. Apart from Darwin which is at almost exactly the same latitude, there is no larger town further north in Australia. (Adapted from a Creative Commons Attribution 4.0 International image by John Tann, from Wikimedia Commons.)

The proposal eventually floundered due to lack of money and protests from indigenous land owners, but there is now a current State Government inquiry into constructing a satellite launching facility in Queensland, again in the far north. As a news story points out, “From a very simple perspective, we’ve got potential launch capacity, being closer to the equator in a place like Queensland,” and “the best place to launch satellites from Australia is the coast of Queensland. The closer you are to the equator, the more kick you get from the Earth’s spin.”[2]

So rocket engineers in the southern hemisphere definitely want to build their launch facilities as close to the equator as practically possible too. Repeating what I said earlier, you’d be crazy not to. And this is a consequence of the fact that the Earth is a rotating globe.

On the other hand, if the Earth were flat and non-rotating (as is the case in the most popular flat Earth models), there would be no such incentive to build your launch facility anywhere compared to anywhere else, and equatorial locations would not be so coveted. And if the Earth were flat and rotating around the north pole, then you’d get your best bang for buck not near the equator, but near the rim of the rotating disc, where the linear speed of rotation is highest. If that were the case, then everyone would be clamouring to build their launch sites as close to Antarctica as possible, which is clearly not the case in the real (globular) world.

[1] Benson, C. D., Faherty, W. B. Moonport: A History of Apollo Launch Facilities and Operations. Chapter 1.2, NASA Special Publication-4204 in the NASA History Series, 1978. https://www.hq.nasa.gov/office/pao/History/SP-4204/contents.html (accessed 2019-07-15).

[2] “Rocket launches touted for Queensland as State Government launches space industry inquiry”. ABC News, 6 September 2018. https://www.abc.net.au/news/2018-09-06/queensland-shoots-for-the-stars-to-become-space-hub/10205686 (accessed 2019-07-15).

18. Polar motion

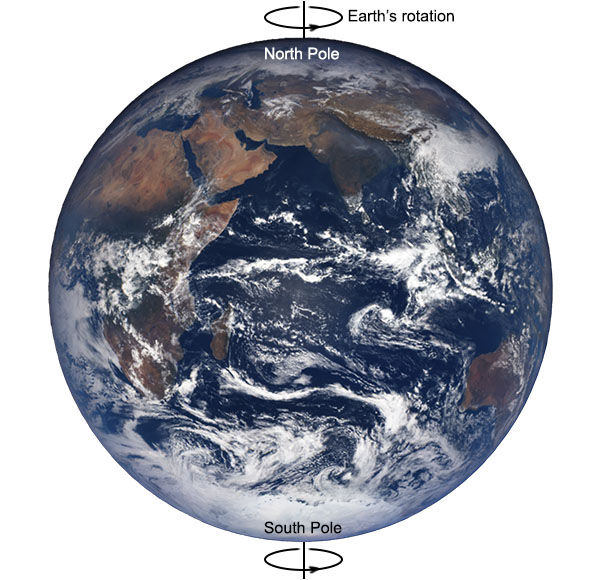
The Earth rotates around an axis, an imaginary straight line that all points not on the line move around in circles. The axis passes through the Earth’s North Pole and the South Pole. So the positions of the two Poles are defined by the position of the rotation axis.

Earth rotation and poles

The Earth’s North and South Poles are defined as the points where the axis of rotation passes through the surface of the planet. (Earth photo is a public domain image from NASA.)

Interestingly, the Earth’s rotation axis is not fixed – it moves slightly. This means that the Earth’s poles move.

The positions of the Earth’s poles can be determined by looking at the motions of the stars. As we’ve already seen, if you observe the positions of stars throughout a night, you will see that they rotate in the sky about a central point. The point on the Earth’s surface directly underneath the centre of rotation of the stars is one of the poles of the Earth.

Star trails in the northern hemisphere

Star trails above Little Hawk Lake in Canada. The northern hemisphere stars rotate around the North Celestial Pole (the point directly above the Earth’s North Pole). The bright spot in the centre is Polaris, the pole star. The circles are somewhat distorted in the upper corners of the photo because of the wide angle lens used. (Creative Commons Attribution 2.0 image by Dave Doe.)

Through the 19th century, astronomers were improving the precision of astronomical observations to the point where the movement of the Earth’s rotational poles needed to be accounted for in the positions of celestial objects. The motion of the poles was also beginning to affect navigation, because as the poles move, so does the grid system of latitude and longitude that ships rely on to reach their destinations and avoid navigational hazards. In 1899 the International Geodetic Association established a branch known as the International Latitude Service.

The fledgling International Latitude Service established a network of six observatories, all located close to latitude 39° 08’ north, spread around the world. The initial observatories were located in Gaithersburg, Maryland, USA; Cincinatti, Ohio, USA; Ukiah, California, USA; Mizusawa, Japan; Charjui, Turkestan; and Carloforte, Italy. The station in Charjui closed due to economic problems caused by war, but a new station opened in Kitab, Uzbekistan after World War I. Each observatory engaged in a program of observing the positions of 144 selected reference stars, and the data from each station were cross referenced to provide accurate measurements of the location of the North Pole.

International Latitude Service station in Ukiah

International Latitude Service station in Ukiah, California. (Public domain image from Wikimedia Commons.)

In 1962, the International Time Bureau founded the International Polar Motion Service, which incorporated the International Latitude Service observations and additional astronomical observations to provide a reference of higher accuracy, suitable for both navigation and defining time relative to Earth’s rotation. Finally in 1987, the the International Astronomical Union and the International Union of Geodesy and Geophysics established the International Earth Rotation Service (IERS), which took over from the International Polar Motion Service. The IERS is the current authority responsible for timekeeping and Earth-based coordinate systems, including the definitions of time units, the introduction of leap seconds to keep clocks in synch with the Earth’s rotation, and definitions of latitude and longitude, as well as measurements of the motion of the Earth’s poles, which are necessary for accurate use of navigation systems such as GPS and Galileo.

The motion of Earth’s poles can be broken down into three components:

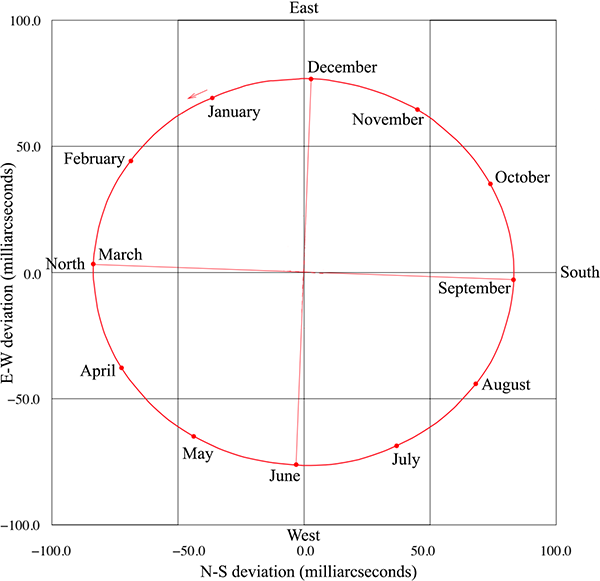
1. An annual elliptical wobble. Over the period of a year, the Earth’s poles move around in an ellipse, with the long axis of the ellipse about 6 metres in length. In March, the North Pole is about 6 metres from where it is in September (though see below). This motion is generally agreed by scientists to be caused by the annual shift in air pressure between winter and summer over the northern and southern hemispheres. In particular there is an imbalance between the Northern Atlantic ocean and Asia, with higher air pressure over the ocean in the northern winter, but higher air pressure over the Asian continent in summer. This change in the mass distribution of the atmosphere is enough to cause the observed wobble.

Annual wobble of North Pole

Annual elliptical wobble of the Earth’s North Pole. Deviation is given in milliarcseconds of axial tilt; 100 milliarcseconds corresponds to a bit over 3 metres at ground level. (Figure adapted from [1].)

2. Superimposed on the annual elliptical wobble is another, circular, wobble, with a period of around 433 days. This is called the Chandler wobble, named after its discoverer, American astronomer Seth Carlo Chandler, who found it in 1891. The Chandler wobble occurs because the Earth is not a perfect sphere. The Earth is slightly elliptical, with the radius at the equator about 20 kilometres larger than the polar radius. When elliptical objects spin, they experience a slight wobble in the rotation known as free nutation. This is the sort of wobble seen in a spinning rugby ball or American football in flight (where the effect is exaggerated by the ball’s exaggerated elliptical shape). This wobble would die away over time, but is driven by changes in the mass distribution of cold and warm water in the oceans and high and low pressure systems in the atmosphere. The Chandler wobble has a diameter of about 9 metres at the poles.

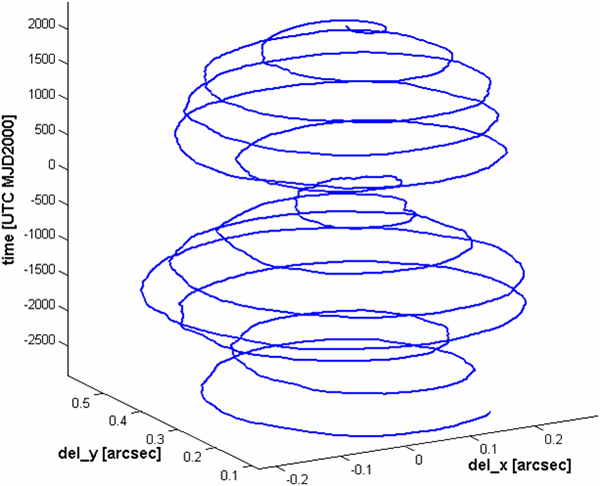
The combined effect of the annual wobble and the Chandler wobble is that the North and South Poles move in a spiralling pattern, sometimes circling with a diameter up to 15 metres, then reducing down to about 3 metres, before increasing again. This beat pattern occurs over a period of about 7 years.

Annual _ Chandler wobble of North Pole

Graph showing the movement of the North Pole over a period of 4500 days (12.3 years), with time on the vertical axis and the spiralling motion mapped in the x and y axes. The motion tickmarks are 0.1 arcsecond in rotation angle of the axis apart, corresponding to about 3 metres of motion along the ground at the Pole. (Public domain image from Wikimedia Commons.)

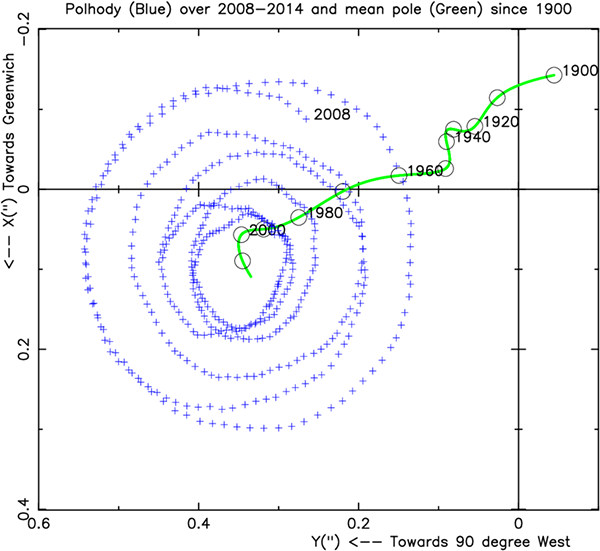
3. The third and final motion of the Earth’s poles is a systematic drift, of about 200 millimetres per year. Since 1900, the central point of the spiral wobbles of the North Pole has drifted by about 20 metres. This drift is caused by changes in the mass distribution of Earth due to shifts in its structure: movement of molten rock in the mantle, isostatic rebound of crust following the last glacial period, and more recently the melting of the Greenland ice sheet. The melting of the Greenland ice sheet in the last few decades has shifted the direction of polar drift dramatically; one of the serious indications of secondary changes to the Earth caused by human-induced climate change. Changes in Earth’s mass distribution alter its rotational moment of inertia, and the rotational axis adjusts to conserve angular momentum.

Motion of North Pole since 1900

Plot of motion of the North Pole since 1900. The actual position of the Pole from 2008 to 2014 is shown with blue crosses, showing the annual and Chandler wobbles. The mean position (i.e. the centre of the wobbles) is shown for 1900 to 2014 as the green line. The pole has mostly drifted towards the 80° west meridian, but has changed direction dramatically since 2000. (Figure reproduced from [2].)

Each of the three components of Earth’s polar motion are: (a) observable with 19th century technology, (b) accurately measurable using current technology, and (c) understandable and quantitatively explainable using the fact that the Earth is a rotating spheroid and our knowledge of its structure.

If the Earth were flat, it would not be possible to reconcile the changes in position of the North and South Poles with the known shifts in mass distribution of the Earth. The Chandler wobble would not even have any reason to exist at close to its observed period unless the Earth was an almost spherical ellipsoid.

References:

[1] Höpfner, J. “Polar motion at seasonal frequencies”. Journal of Geodynamics, 22, p. 51-61, 1996. https://doi.org/10.1016/0264-3707(96)00012-9

[2] Dick, W., Thaller, D. IERS Annual Report 2013. International Earth Rotation Service, 2014. https://www.iers.org/IERS/EN/Publications/AnnualReports/AnnualReport2013.html