36. The visible stars

When our ancestors looked up into the night sky, they beheld the wonder of the stars. With our ubiquitous electrical lighting, many of us don’t see the same view today – our city skies are too bright from artificial light (previously discussed under Skyglow). We can see the brightest handful of stars, but most of us have forgotten how to navigate the night sky, recognising the constellations and other features such as the intricately structured band of the Milky Way and the Magellanic Clouds. There are features in the night sky other than stars (the moon, the planets, meteors, and comets), but we’re going to concentrate on the stars.

The night sky, showing the Milky Way

Composite image of the night sky from the European Southern Observatory at Cerro Paranal, Chile, showing the Milky Way (bright band) and the two Magellanic Clouds (far left). (Creative Commons Attribution 4.0 International image by the European Southern Observatory.)

The Milky Way counts because it is made of stars. To our ancestors, it resembled a stream of milk flung across the night sky, a continuous band of brightness. But a small telescope reveals that it is made up of millions of faint stars, packed so closely that they blend together to our naked eyes. The Milky Way is our galaxy, a collection of roughly 100 billion stars and their planets.

The stars are apparently fixed in place with respect to one another. (Unlike the moon, planets, meteors, and comets, which move relative to the stars, thus distinguishing them.) The stars are not fixed in the sky relative to the Earth though. Each night, the stars wheel around in circles in the sky, moving over the hours as if stuck to the sky and the sky itself is rotating.

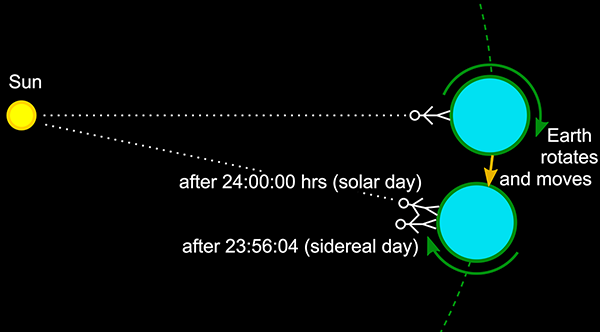
The stars move in their circles and come back to the same position in the sky approximately a day later. But not exactly a day later. The stars return to the same position after 23 hours, 56 minutes, and a little over 4 seconds, if you time it precisely. We measure our days by the sun, which appears to move through the sky in roughly the same way as the stars, but which moves more slowly, taking a full 24 hours (on average, over the course of a year) to return to the same position.

This difference is caused by the physical arrangement of the sun, Earth, and stars. Our Earth spins around on its axis once every 23 hours, 56 minutes, and 4 and a bit seconds. However in this time it has also moved in its orbit around the sun, by a distance of approximately one full orbit (which takes a year) divided by 365.24 (the average number of days in a year). This means that from the viewpoint of a person on Earth, the sun has moved a little bit relative to the stars, and it takes an extra (day/365.24) = 236 seconds for the Earth to rotate far enough for the sun to appear as though it has returned to the same position. This is why the solar day (the way we measure time with our clocks) is almost 4 minutes longer than the Earth’s rotation period (called the sidereal day, “sidereal” meaning “relative to the stars”).

Sidereal and solar days

Diagram showing the difference between a sidereal day (23 hours, 56 minutes, 4 seconds) when the Earth has rotated once, and a solar day (24 hours) when the sun appears in the same position to an observer on Earth.

Another way of looking at is that in one year the Earth spins on its axis 366.24 times, but in that same time the Earth has moved once around the sun, so only 365.24 solar days have passed. The sidereal day is thus 365.24/366.24 = 99.727% of the length of the solar day.

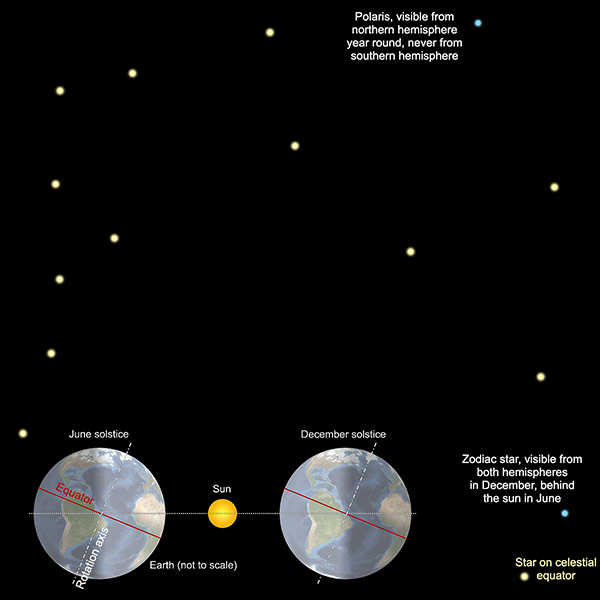
The consequence of all this is that slowly, throughout the year, the stars we see at night change. On 1 January, some stars are hidden directly behind the sun, and we can’t see them or nearby stars, because they are in the sky during the day, when their light is drowned out by the light of the sun. But six months later, the Earth is on the other side of its orbit, and those stars are now high in the sky at midnight and easily visible, whereas some of the stars that were visible in January are now in the sky at daytime and obscured.

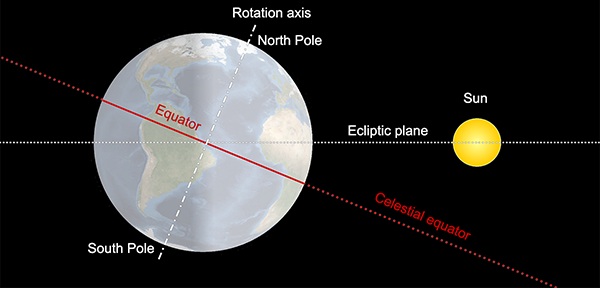
This change in visibility of the stars over the course of a year applies mostly to stars above the equatorial regions. If we imagine the equator of the Earth extended directly upwards (a bit like the rings of Saturn) towards the stars, it defines a plane cutting the sky in half. This plane is called the celestial equator.

However the sun doesn’t move along this path. The Earth’s axis is tilted relative to its orbit by an angle of approximately 23.5°. So the sun’s apparent path through the sky moves up and down by ±23.5° over the course of a year, which is what causes our seasons. When the sun is higher in the sky it is summer, when it’s lower, it’s winter.

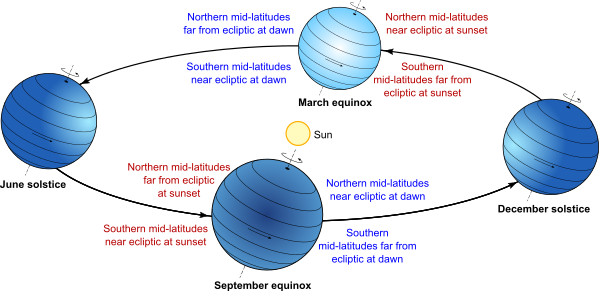
So as well as the celestial equator, there is another plane bisecting the sky, the plane that the sun appears to follow around the Earth – or equivalently, the plane of the Earth’s (and other planets’) orbit around the sun. This plane is called the ecliptic. It’s the stars along and close to the ecliptic that appear the closest to and thus the most obscured by the sun throughout the year.

Celestial equator and ecliptic plane

Diagram of the celestial equator and the ecliptic plane relative to the Earth and sun (sizes and distances not to scale). The Earth revolves around the sun in the ecliptic plane. (Adapted from a public domain image by NASA, from Wikimedia Commons.)

The constellations of the ecliptic have another name: the zodiac. We’ve met this term before as part of the name of the zodiacal light. The zodiacal light occurs in the plane of the planetary orbits, the ecliptic, which is the same as the plane of the zodiac. As an aside, the constellations of the zodiac include those familiar to people through the pre-scientific tradition of Western astrology: Aries, Taurus, Gemini, Cancer, Leo, Virgo, Libra, Scorpius (“Scorpio” in astrology), Ophiuchus (ignored in astrology), Sagittarius, Capricornus (“Capricorn” in astrology), Aquarius, and Pisces. The system of astrology abstracts these real-world constellations into 12 idealised segments of the sky, each covering exactly 30° of the circle (in fact the constellations cover different amounts), and assigns portentous meanings to the positions of the sun, moon, and planets within each segment.

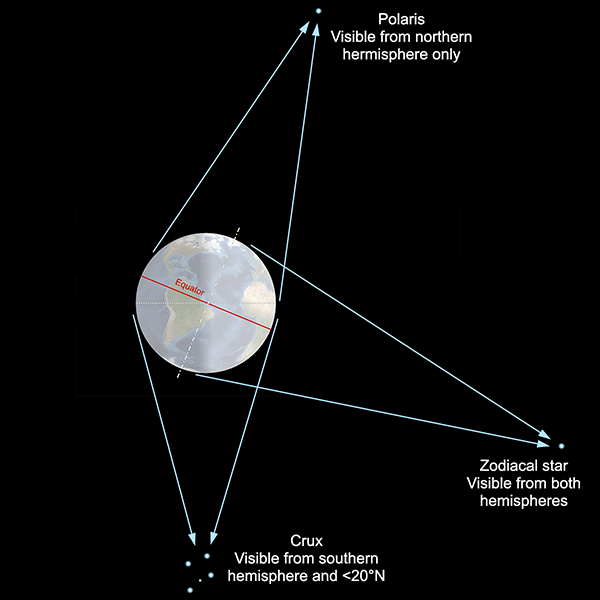
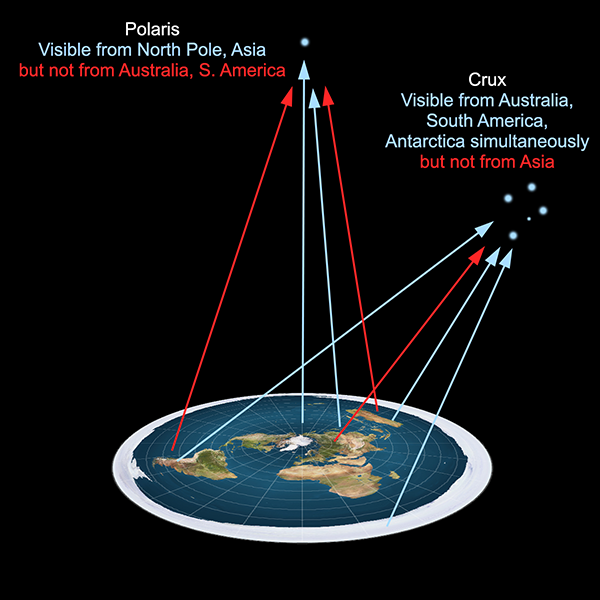
The stars close to the zodiac are completely obscured by the sun for part of the year, while the stars near the celestial equator appear close to the sun but might still be visible (with difficulty) immediately after sunset or before dawn. The stars far from these planes, however, are more easily visible throughout the whole year. The north star, Polaris, is almost directly above the North Pole, and it and stars nearby are visible from most of the northern hemisphere year-round. There is no equivalent “south pole star”, but the most southerly constellations—such as the recognisable Crux, or Southern Cross—are similarly visible year-round through most of the southern hemisphere.

Axial tilt of Earth

Diagram showing the axial tilt of the Earth relative to the plane of the orbit (the ecliptic), and the positions of Polaris and stars in the zodiac and on the celestial equator. Sizes and distances are not to scale – in reality Polaris is so far away that the angle it makes between the June and December positions of Earth is only 0.007 seconds of arc (about a five millionth of a degree).

Interestingly, Polaris is never visible from the southern hemisphere. Similarly, Crux is not visible from almost all of the northern hemisphere, except for a band close to the equator, from where it appears extremely low on the southern horizon. Crux is centred around 60° south, celestial latitude (usually known as declination), which means that it is below the horizon from all points north of latitude 30°N. (In practice, stars near the horizon are obscured by topography and the long path through the atmosphere, so it is difficult to spot Crux from anywhere north of about 20°N.)

In general, stars at a given declination can never be seen from Earth latitudes 90° or more away, and only with difficulty from 80°-90° away. The reason is straightforward enough. From our spherical Earth, if you are standing at latitude x°N, all parts of the sky from (90-x)°S declination to the south celestial pole are below the horizon. And similarly if you’re at x°S, all parts of the sky from (90-x)°N declination to the north celestial pole are below the horizon. The Earth itself is in the way.

On the other hand, if you are standing at latitude x°N, all parts of the sky north of the same declination are visible every night of the year, while stars between x°N and (90-x)°S are visible only at certain times of the year.

Visibility of stars from globe Earth

Visibility of stars from parts of Earth is determined simply by sightlines from the surface of the globe.

With a spherical Earth, the geometry of the visibility of stars is readily understandable. On a flat Earth, however, there’s no obvious reason why some stars would be visible from some parts of the Earth and not others, let alone the details of how the visibilities change with latitude and throughout the year.

If we consider the usual flat Earth model, with the North Pole at the centre of a disc, and southern regions around the rim, it is difficult to imagine how Polaris can be seen from regions north of the equator but not south of it. And it is even more difficult to justify how it is even possible for southern stars such as those in Crux being visible from Australia, southern Africa, and South America but not from anywhere near the centre of the disc. The southern stars can be seen in the night sky from any two of these locations simultaneously, but if you use a radio telescope during daylight you can observe the same stars from all three at once. Things get even worse with Antarctica. In the southern winter, it is night at virtually every location in Antarctica at the same time, and many of the same stars are visible, yet cannot be seen from the northern hemisphere.

Visibility of stars from flat Earth

Visibility of stars from a flat Earth. All stars must be above the plane, but why are some visible in some parts of the world but not others? Particularly the southern stars, which can be seen from widely separated locations but not regions in the middle of them.

In any flat Earth model, there should be a direct line of sight from every location to any object above the plane of the Earth. To attempt to explain why there isn’t requires special pleading to contrived circumstances such as otherwise undetectable objects blocking lines of sight, or light rays bending or being dimmed in ways inconsistent with known physics.

The fact that when you look up at night, you can’t see all the stars visible from other parts of the Earth, is a simple consequence of the fact that the Earth is a globe.

26. Skyglow

Skyglow is the diffuse illumination of the night sky by light sources other than large astronomical objects. Sometimes this is considered to include diffuse natural sources such as the zodiacal light (discussed in a previous proof), or the faint glow of the atmosphere itself caused by incoming cosmic radiation (called airglow), but primarily skyglow is considered to be the product of artificial lighting caused by human activity. In this context, skyglow is essentially the form of light pollution which causes the night sky to appear brighter near large sources of artificial light (i.e. cities and towns), drowning out natural night sky sources such as fainter stars.

Skyglow from Keys View

Skyglow from the cities of the Coachella Valley in California, as seen from Keys View lookout, Joshua Tree National Park, approximately 20 km away. (Public domain image by U.S. National Park Service/Lian Law, from Flickr.)

The sky above a city appears to glow due to the scattering of light off gas molecules and aerosols (i.e. dust particles, and suspended liquid droplets in the air). Scattering of light from air molecules (primarily nitrogen and oxygen) is called Rayleigh scattering. This is the same mechanism that causes the daytime sky to appear blue, due to scattering of sunlight. Although blue light is scattered more strongly, the overall colour effect is different for relatively nearby light sources than it is for sunlight. Much of the blue light is also scattered away from our line of sight, so skyglow caused by Rayleigh scattering ends up a similar colour to the light sources. Scattering off aerosol particles is called Mie scattering, and is much less dependent on wavelength, so also has little effect on the colour of the scattered light.

Skyglow from Cholla

Skyglow from the cities of the Coachella Valley in California, as seen from Cholla Cactus Garden, Joshua Tree National Park, approximately 40 km away. (Public domain image by U.S. National Park Service/Hannah Schwalbe, from Flickr.)

Despite the relative independence of scattered light on wavelength, bluer light sources result in a brighter skyglow as perceived by humans. This is due to a psychophysical effect of our optical systems known as the Purkinje effect. At low light levels, the rod cells in our retinas provide most of the sensory information, rather than the colour-sensitive cone cells. Rod cells are more sensitive to blue-green light than they are to redder light. This means that at low light levels, we are relatively more sensitive to blue light (compared to red light) than we are at high light levels. Hence skyglow caused by blue lights appears brighter than skyglow caused by red lights of similar perceptual brightness.

Artificially produced skyglow appears prominently in the sky above cities. It makes the whole night sky as seen from within the city brighter, making it difficult or impossible to see fainter stars. At its worst, skyglow within a city can drown out virtually all night time astronomical objects other than the moon, Venus, and Jupiter. The skyglow from a city can also be seen from dark places up to hundreds of kilometres away, as a dome of bright sky above the location of the city on the horizon.

Skyglow from Ashurst Lake

Skyglow from the cities of Phoenix and Flagstaff, as seen from Ashurst Lake, Arizona, rendered in false colour. Although the skyglow from each city is visible, the cities themselves are below the horizon and not visible directly. The arc of light reaching up into the sky is the Milky Way. (Public domain image by the U.S. National Park Service, from Wikipedia.)

However, although the skyglow from a city can be seen from such a distance, the much brighter lights of the city itself cannot be seen directly – because they are below the horizon. The fact that you can observe the fainter glow of the sky above a city while not being able to see the lights of the city directly is because of the curvature of the Earth.

This is not the only effect of Earth’s curvature on the appearance of skyglow; it also effects the brightness of the glow. In the absence of any scattering or absorption, the intensity of light falls off with distance from the source following an inverse square law. Physically, this is because the surface area of spherical shells of increasing radius from a light source increase as the square of the radius. So the same light flux has to “spread out” to cover an area equal to the square of the distance, thus by the conservation of energy its brightness at any point is proportional to one divided by the square of the distance. (The same argument applies to many phenomena whose strengths vary with distance, and is why inverse square laws are so common in physics.)

Skyglow, however, is also affected by scattering and absorption in the atmosphere. The result is that the brightness falls off more rapidly with distance from the light source. In 1977, Merle F. Walker of Lick Observatory in California published a study of the sky brightness caused by skyglow at varying distances from several southern Californian cities[1]. He found an empirical relationship that the intensity of skyglow varies as the inverse of distance to the power of 2.5.

Skyglow intensity versus distance from Salinas

Plot of skyglow intensity versus distance from Salinas, California. V is the “visual” light band and B the blue band of the UBV photometric system, which are bands of about 90 nanometres width centred around wavelengths of 540 and 442 nm respectively. The fitted line corresponds to intensity ∝ (distance)-2.5. (Figure reproduced from [1].)

This relationship, known as Walker’s law, has been confirmed by later studies, with one notable addition. It only holds for distances up to 50-100 kilometres from the city. When you travel further away from a city, the intensity of the skyglow starts to fall off more rapidly than Walker’s law suggests, a little bit faster at first, but then more and more rapidly. This is because as well as the absorption effect, the scattered light path is getting longer and more complex due to the curvature of the Earth.

A later study by prominent astronomical light pollution researcher Roy Henry Garstang published in 1989 examined data from multiple cities in Colorado, California, and Ontario to produce a more detailed model of the intensity of skyglow[2]. The model was then tested and verified for multiple astronomical sites in the mainland USA, Hawaii, Canada, Australia, France, and Chile. Importantly for our perspective, the model Garstang came up with requires the Earth’s surface to be curved.

Skyglow intensity model geometry

Geometrical diagrams for calculating intensity of skyglow caused by cities, from Garstang. The observer is located at O, atop a mountain A. Light from a city C travels upward along the path s until it is scattered into the observer’s field of view at point Q. The centre of the spherical Earth is at S, off the bottom of the figure. (Figure reproduced from [2].)

Interestingly, Garstang also calculated a model for the intensity of skyglow if you assume the Earth is flat. He did this because it greatly simplifies the geometry and the resulting algebra, to see if it produced results that were good enough. However, quoting directly from the paper:

In general, flat-Earth models are satisfactory for small city distances and observations at small zenith distances. As a rough rule of thumb we can say that for calculations of night-sky brightnesses not too far from the zenith the curvature of the Earth is unimportant for distances of the observer of up to 50 km from a city, at which distance the effect of curvature is typically 2%. For larger distances the curved-Earth model should always be used, and the curved-Earth model should be used at smaller distances when calculating for large zenith distances. In general we would use the curved-Earth model for all cases except for city-center calculations. […] As would be expected, we find that the inclusion of the curvature of the Earth causes the brightness of large, distant cities to fall off more rapidly with distance than for a flat-Earth model.

In other words, to get acceptably accurate results for either distances over 50 km or for large zenith angles at any distance, you need to use the spherical Earth model – because assuming the Earth is flat gives you a significantly wrong answer.

This result is confirmed experimentally again in a 2007 paper[3], as shown in the following diagram:

Skyglow intensity versus distance from Salinas from Las Vegas

Plot of skyglow intensity versus distance from Las Vegas as observed at various dark sky locations in Nevada, Arizona, and California. The dashed line is Walker’s Law, with an inverse power relationship of 2.5. Skyglow at Rogers Peak, more than 100 km away, is less than predicted by Walker’s Law, “due to the Earth’s curvature complicating the light path” (quoted from the paper). (Figure reproduced from [3].)

So astronomers, who are justifiably concerned with knowing exactly how much light pollution from our cities they need to contend with at their observing sites, calculate the intensity of skyglow using a model that is significantly more accurate if you include the curvature of the Earth. Using a flat Earth model, which might otherwise be preferred for simplicity, simply isn’t good enough – because it doesn’t model reality as well as a spherical Earth.

References:

[1] Walker, M. F. “The effects of urban lighting on the brightness of the night sky”. Publications of the Astronomical Society of the Pacific, 89, p. 405-409, 1977. https://doi.org/10.1086/130142

[2] Garstang, R. H. “Night sky brightness at observatories and sites”. Publications of the Astronomical Society of the Pacific, 101, p. 306-329, 1989. https://doi.org/10.1086/132436

[3] Duriscoe, Dan M., Luginbuhl, Christian B., Moore, Chadwick A. “Measuring Night-Sky Brightness with a Wide-Field CCD Camera”. Publications of the Astronomical Society of the Pacific, 119, p. 192-213, 2007. https://dx.doi.org/10.1086/512069

21. Zodiacal light

Brian May is best known as the guitarist of the rock band Queen.[1] The band formed in 1970 with four university students: May, drummer Roger Taylor (not the drummer Roger Taylor who later played for Duran Duran), singer Farrokh “Freddie” Bulsara, and bassist Mike Grose, playing their first gig at Imperial College in London on 18 July. Freddie soon changed his surname to Mercury, and after trying a few other bass players the band settled on John Deacon.

Brian May 1972

Brian May, student, around 1972, with some equipment related to his university studies. (Reproduced from [2].)

While May continued his studies, the fledgling band recorded songs, realeasing a debut self-titled album, Queen, in 1973. It had limited success, but they followed up with two more albums in 1974: Queen II and Sheer Heart Attack. These met with much greater success, reaching numbers 5 and 2 on the UK album charts respectively. With this commercial success, Brian May decided to drop his academic ambitions, leaving his Ph.D. studies incomplete. Queen would go on to become one of the most successful bands of all time.

Lead singer Freddie Mercury died of complications from AIDS in 1991. This devastated the band and they stopped performing and recording for some time. In 1994 they released a final studio album, consisting of reworked material recorded by Mercury before he died plus some new recording to fill gaps. And since then May and Taylor have performed occasional concerts with guest singers, billed as Queen + (singer).

The down time and the wealth accumulated over a successful music career allowed Brian May to apply to resume his Ph.D. studies in 2006. He first had to catch up on 33 years of research in his area of study, then complete his experimental work and write up his thesis. He submitted it in 2007 and graduated as a Doctor of Philosophy in the field of astrophysics in 2008.

Brian May 2008

Dr Brian May, astrophysicist, in 2008. (Public domain image from Wikimedia Commons.)

May’s thesis was titled: A Survey of Radial Velocities in the Zodiacal Dust Cloud.[2] May was able to catch up and complete his thesis because the zodiacal dust cloud is a relatively neglected topic in astrophysics, and there was only a small amount of research done on it in the intervening years.

We’ve already met the zodiacal dust cloud (which is also known as the interplanetary dust cloud). It is a disc of dust particles ranging from 10 to 100 micrometres in size, concentrated in the ecliptic plane, the plane of orbit of the planets. Backscattered reflection off this disc of dust particles causes the previously discussed gegenschein phenomenon, visible as a glow in the night sky at the point directly opposite the sun (i.e. when the sun is hidden behind the Earth).

But that’s not the only visible evidence of the zodiacal dust cloud. As stated in the proof using gegenschein:

Most of the light is scattered by very small angles, emerging close to the direction of the original incoming beam of light. As the scattering angle increases, less and less light is scattered in those directions. Until you reach a point somewhere around 90°, where the scattering is a minimum, and then the intensity of scattered light starts climbing up again as the angle continues to increase. It reaches its second maximum at 180°, where light is reflected directly back towards the source.

This implies that there should be another maximum of light scattered off the zodiacal dust cloud, along lines of sight close to the sun. And indeed there is. It is called the zodiacal light. The zodiacal light was first described scientifically by Giovanni Cassini in 1685[3], though there is some evidence that the phenomenon was known centuries earlier.

Title page of Cassini's discovery

Title page of Cassini’s discovery announcement of the zodiacal light. (Reproduced from [3].)

Unlike gegenschein, which is most easily seen high overhead at midnight, the zodiacal light is best seen just after sunset or just before dawn, because it appears close to the sun. The zodiacal light is a broad, roughly triangular band of light which is broadest at the horizon, narrowing as it extends up into the sky along the ecliptic plane. The broad end of the zodiacal light points directly towards the direction of the sun below the horizon. This in itself provides evidence that the sun is in fact below the Earth’s horizon at night.

zodiacal light at Paranal

Zodiacal light seen from near the tropics, Paranal Observatory, Chile. Note the band of light is almost vertical. (Creative Commons Attribution 4.0 International image by ESO/Y.Beletsky, from Wikimedia Commons.)

The zodiacal light is most easily seen in the tropics, because, as Brian May writes: “it is here that the cone of light is inclined at a high angle to the horizon, making it still visible when the Sun is well below the horizon, and the sky is completely dark.”[2] This is because the zodiacal dust is concentrated in the plane of the ecliptic, so the reflected sunlight forms an elongated band in the sky, showing the plane of the ecliptic, and the ecliptic is at a high, almost vertical angle, when observed from the tropics.

zodiacal light at Washington

Zodiacal light observed from a mid-latitude, Washington D.C., sketched by Étienne Léopold Trouvelot in 1876. The band of light is inclined at an angle. (Public domain image from Wikimedia Commons.)

Unlike most other astronomical phenomena, this shows us in a single glance the position of a well-defined plane in space. From tropical regions, we can see that the plane is close to vertical with respect to the ground. At mid-latitudes, the plane of the zodiacal light is inclined closer to the ground plane. And at polar latitudes the zodiacal light is almost parallel to the ground. These observations show that at different latitudes the surface of the Earth is inclined at different angles to a visible reference plane in the sky. The Earth’s surface must be curved (in fact spherical) for this to be so.

zodiacal light from Europe

Zodiacal light observed from higher latitude, in Europe. The band of light is inclined at an even steeper angle. (Public domain image reproduced from [4].)

[I could not find a good royalty-free image of the zodiacal light from near-polar latitudes, but here is a link to copyright image on Flickr, taken from Kodiak, Alaska. Observe that the band of the zodiacal light (at left) is inclined at more than 45° from the vertical. https://www.flickr.com/photos/photonaddict/39974474754/ ]

zodiacal light at Mauna Kea

Zodiacal light seen over the Submillimetre Array at Mauna Kea Observatories. (Creative Commons Attribution 4.0 International by Steven Keys and keysphotography.com, from Wikimedia Commons.)

Furthermore, at mid-latitudes the zodiacal light is most easily observed at different times in the different hemispheres, and these times change with the date during the year. Around the March equinox, the zodiacal light is best observed from the northern hemisphere after sunset, while it is best observed from the southern hemisphere before dawn. However around the September equinox it is best observed from the northern hemisphere before dawn and from the southern hemisphere after sunset. It is less visible in both hemispheres at either of the solstices.

seasonal variation in zodiacal light from Tenerife

Seasonal variation in visibility of the zodiacal light, as observed by Brian May from Tenerife in 1971. The horizontal axis is day of the year. The central plot shows time of night on the vertical axis, showing periods of dark night sky (blank areas), twilight (horizontal hatched bands), and moonlight (vertical hatched bands). The upper plot shows the angle of inclination of the ecliptic (and hence the zodiacal light) at dawn, which is a maximum of 87° on the September equinox, and a minimum of 35° on the March equinox. The lower plot shows the angle of inclination of the ecliptic at sunset, which is a maximum of 87° on the March equinox. (Reproduced from [2].)

This change in visibility is because of the relative angles of the Earth’s surface to the plane of the dust disc. At the March equinox, northern mid-latitudes are closest to the ecliptic at local sunset, but far from the ecliptic at dawn, while southern mid-latitudes are close to the ecliptic at dawn and far from it at sunset. The situation is reversed at the September equinox. At the solstices, mid-latitudes in both hemispheres are at intermediate positions relative to the ecliptic.

seasonal variation of Earth with respect to ecliptic

Diagram of the Earth’s tilt relative to the ecliptic, showing how different latitudes are further from or closer to the ecliptic at certain times of year and day.

So the different seasonal visibility and angles of the zodiacal light are also caused by the fact that the Earth is spherical, and inclined at an angle to the ecliptic plane. This natural explanation does not carry over to a flat Earth model, and none of the observations of the zodiacal light have any simple explanation.

References:

[1] Google search, “what is brian may famous for”, https://www.google.com/search?q=what+is+brian+may+famous+for (accessed 2019-07-23).

[2] May, B. H. A Survey of Radial Velocities in the Zodiacal Dust Cloud. Ph.D. thesis, Imperial College London, 2008. https://doi.org/10.1007%2F978-0-387-77706-1

[3] Cassini, G. D. “Découverte de la lumière celeste qui paroist dans le zodiaque” (“Discovery of the celestial light that resides in the zodiac”). De l’lmprimerie Royale, par Sebastien Mabre-Cramoisy, Paris, 1685. https://doi.org/10.3931/e-rara-7552

[4] Guillemin, A. Le Ciel Notions Élémentaires D’Astronomie Physique, Libartie Hachette et Cie, Paris, 1877. https://books.google.com/books?id=v6V89Maw_OAC

16. Lunar eclipses

Lunar eclipses occur when the Earth is positioned between the sun and the moon, so that the Earth blocks some or all of the sunlight from directly reaching the moon. Because of the relative sizes of the sun, Earth, and moon, and their distances from one another, the Earth’s shadow is large enough to completely cover the moon.

To talk about eclipses, we need to define some terms. The sun is a large, extended source of light, not a point source, so the shadows that objects cast in sunlight have two components: the umbra, where light from the sun is totally blocked, and the penumbra, where light from the sun is partially blocked.

Umbra and penumbra

Diagram showing the umbra and penumbra cast by the Earth. Not to scale. Public domain image from Wikimedia Commons.

When the moon passes entirely inside the Earth’s umbra, that is a total lunar eclipse. Although no sunlight reaches the moon directly, the moon is not completely dark, because some sunlight refracts (bends) through the Earth’s atmosphere and reaches the moon. This light is red for the same reason that sunsets on Earth tend to be red: the atmosphere scatters blue light more easily than red, so red light penetrates large distances of air more easily. This is why during a total lunar eclipse the moon is a reddish colour. Although a totally eclipsed moon looks bright enough to our eyes, it’s actually very dark compared to a normal full moon. Our eyes are very good at compensating for the different light levels without us being aware of it.

Total lunar eclipse

Total lunar eclipse of 28 August 2007 (photographed by me). 1 second exposure at ISO 800 and aperture f/2.8.

The amount of refracted light reaching the moon depends on the cleanliness of the Earth’s atmosphere. If there have been recent major volcanic eruptions, then significantly less light passes through to reach the moon. The brightness of the moon during a total lunar eclipse can be measured using the Danjon scale, ranging from 0 for very dark eclipses, to 4 for the brightest ones. After the eruption of Mount Pinatubo in the Philippines in 1991, the next few lunar eclipses were extremely dark, with the eclipse of December 1992 rating a 0 on the Danjon scale.

When the moon is only partly inside the Earth’s umbra, that is a partial lunar eclipse. A partial phase occurs on either side of a total lunar eclipse, as the moon passes through the Earth’s shadow, and it can also occur as the maximal phase of an eclipse if the moon’s orbit isn’t aligned to carry it fully within the umbra. During a partial eclipse phase, you can see the edge of the Earth’s umbral shadow on the moon.

Partial lunar eclipse phase

Partial phase of the same lunar eclipse of 28 August 2007. 1/60 second exposure at ISO 100 and f/8, which is 1/3840 the exposure of the totality photo above. If this photo was 3840 times as bright, the dark part at the bottom would look as bright as the totality photo (and the bright part would be completely washed out).

Lunar eclipses can only occur at the full moon – those times when the sun and moon are on opposite sides of the Earth. The moon orbits the Earth roughly once every 29.5 days and so full moons occur every 29.5 days. However, lunar eclipses occur only two to five times per year, because the moon’s orbit is tilted by 5.1° relative to the plane of the Earth’s orbit around the sun. This means that sometimes when the moon is full it is above or below the Earth’s shadow, rather than inside it.

Okay, so what can lunar eclipses tell us about the shape of the Earth? A lunar eclipse is a unique opportunity to see the shape of the Earth via its shadow. A shadow is the same shape as a cross-section of the object casting the shadow. Let’s have another look at the shape of Earth’s shadow on the moon, in a series of photos taken during a lunar eclipse:

Lunar eclipse montage

Montage of photos taken over 83 minutes during the lunar eclipse of 28 August 2007. Again, the bottom row of photos have 3840 times the exposure of the top row, so the eclipsed moon is nearly 4000 times dimmer than the full moon.

As you can see, the edge of the Earth’s shadow is curved. The fact that the moon’s surface is curved doesn’t affect this, because we are looking from the same direction as the Earth, so we see the same cross-section of the moon. (Your own shadow looks the shape of a person to you, even if it falls on an irregular surface where it looks distorted to someone else.) So from this observation we can conclude that the edge of the Earth is rounded.

Many shapes can cause a rounded shadow. However, if you observe multiple lunar eclipses, you will see that the Earth’s shadow is always round, and what’s more, it always has the same radius of curvature. And different lunar eclipses occur at any given location on Earth with the moon at different points in the sky, including sometimes when the moon is not in the sky (because the location is facing away from the moon). This means that different lunar eclipses occur when different parts of the Earth are facing the moon, which means that different parts of the Earth’s edge are casting the shadow edge on the moon. So from these observation, we can see that the shape of the shadow does not depend on the orientation of the Earth to the moon.

There is only one solid shape for which the shape of its shadow doesn’t depend on the object’s orientation. A sphere. So observations of lunar eclipses show that the Earth is a globe.

Addendum: A common rebuttal by Flat Earthers is that lunar eclipses are not caused by the Earth’s shadow, but by some other mechanism entirely – usually another celestial object getting between the sun and moon and blocking the light. But any such object is apparently the same colour as the sky, making it mysteriously otherwise completely undetectable, and does not have the simple elegance of explanation (and the supporting evidence from numerous other observations) of the moon moving around the Earth and entering its shadow.

6. Gegenschein

[audio version of this article]

If you shine a light into a suspension of fine particles, the particles will scatter the light. This is easy enough to show with a little bit of flour stirred into a glass of water, or with a dilute solution of milk in water, in which case the particles are small globules of fat. You can see a beam of light passing through such a medium because of the scattering, which is known as the Tyndall effect.

We can model the interaction of light with the scattering particles using Mie scattering theory, named after German physicist Gustav Mie. This is essentially a set of solutions of Maxwell’s equations for the propagation of electromagnetic radiation (in this case, light) in the presence of the scattering objects. If you solve these equations for diffuse particles a bit bigger than the wavelength of light, you can derive the angular distribution of the scattered light. The scattering is far from uniform in all directions. Rather, it has two distinct lobes. Most of the light is scattered by very small angles, emerging close to the direction of the original incoming beam of light. As the scattering angle increases, less and less light is scattered in those directions. Until you reach a point somewhere around 90°, where the scattering is a minimum, and then the intensity of scattered light starts climbing up again as the angle continues to increase. It reaches its second maximum at 180°, where light is reflected directly back towards the source.

This bright spot of reflected light back towards the source is called backscatter. It can be seen when shining light into smoke or fog. It’s the reason why some cars have special fog lights, angled down to illuminate the road, rather than shine straight into the fog and reflect back into the driver’s eyes. Backscatter is also the reason for the bright spot you might have noticed when flying, on clouds below you around the shadow of the plane (at the centre of the related optical phenomenon of glories).

Another place where there is a collection of smoke-sized particles is in interplanetary space. In the plane of the planets’ orbits around the sun, there is a considerable amount of left over material of sizes around 10 to 100 micrometres, constantly being replenished by asteroid collisions and outgassing from comets. This material is called the interplanetary dust cloud, or the zodiacal dust cloud, because it is densest in the ecliptic—the plane of the planets—which runs through the zodiac constellations. This dust has been sampled directly by several deep space probes: Pioneers 10 and 11, Ulysses, Galileo, Cassini, and New Horizons.

The brightest source of light in the solar system is the sun. As it shines through this interplanetary dust cloud, some of the light is scattered. Most of the scattered light is deflected only by small angles, in accordance with Mie theory. But some is backscattered, and in the backscatter direction there is a peak in brightness of the scattered light directly back towards the sun. S. S. Hong published a paper in 1985, with calculations of the scattering angles of light by the interplanetary dust cloud [1]. Here’s the pertinent plot from the paper:

Scattering intensity v. angle for interplanetary dust

Scattering intensity versus scattering angle for interplanetary dust. Figure reproduced from [1].

The different curves correspond to different choices of a power law to model the size distribution of the dust particles. In each case you can see that most of the scattering occurs at small angles, there is a minimum of scattering intensity around 90°, and the scattering increases again to a second maximum at 180°, the backscattering angle.

As an aside, this backscattering also occurs in interstellar dust, and here’s a figure from a paper by B. T. Draine showing scattering intensity versus angle for the measured dust distributions of the Small Magellanic Cloud, Large Magellanic Cloud, and Milky Way galaxy, plotted for several wavelengths of light [2]. The wavelengths are shown in Angstroms, and in these units visible light occurs between 4000 and 7000 Å (lower being ultraviolet and higher infrared). In these cases the models show minima in scattering around 130°, with the backscattering again being maximal at 180°.

Scattering intensity v. angle for interstellar dust

Scattering intensity versus scattering angle for interstellar dust. Figure reproduced from [2].

We’re not concerned with interstellar dust here, but it shows the general principle that there is a peak in scattered light directly back towards the light source, from fog, smoke, and space dust.

We are concerned with backscatter from the interplanetary dust cloud. Given that this phenomenon occurs, it implies that if we could look into space in the direction exactly opposite the direction of the sun, then we should see backscatter from the interplanetary dust.

If the Earth is spherical, then night time corresponds to the sun being behind the planet. You should see, in the night sky, the point exactly opposite the direction of the sun. You should be able to see, in that direction, the backscattered light of the sun from the interplanetary dust cloud.

Now let’s imagine the Earth is flat. The sun shines on some part of the Earth at all times, so therefore it must be above the plane of the Earth at all times. (How some parts of that plane are in the dark of night is a question for another time. Some Flat Earth models propose a sort of cosmic lampshade for the sun, which makes it more like a spotlight.) At any rate, it should never be possible to look into the sky in the exact opposite direction to the sun. So there should be no point in the night sky with a peak of backscattered sunlight.

Now that we’ve made the predictions from our models, what do we actually see? It turns out that the backscattered sunlight is a visible phenomenon, and it can be seen exactly where predicted by the spherical Earth model. It’s a faint glow in the night sky, centred on the point in the exact opposite direction to the sun. It’s highly likely that pre-industrial civilisations would have observed this glow in their dark night skies, but not had any idea of its significance. The earliest recorded description of it comes from 1730, by the French astronomer Esprit Pézenas. The German explorer Alexander von Humboldt wrote about it around 1800 on a trip to South America, and gave it the name Gegenschein (German for “counter-shine”).

Unfortunately, in our modern industrial society light pollution is so bad that it’s almost impossible to see the gegenschein anywhere near where people live. You need to go somewhere remote and far away from any settlements, where it is truly dark at night. If you do that, you can see something like this:

Gegenschein

Gegenschein, as seen from the Very Large Telescope site, Cerro Paranal, Chile. (Photo: Creative Commons Attribution 4.0 International by the European Southern Observatory.)

The gegenschein is the glow in the sky just above the centre of the image. Heck, it’s so beautiful, here’s another one:

Gegenschein

Gegenschein, as seen from the Very Large Telescope site, Cerro Paranal, Chile. (Photo: Creative Commons Attribution 4.0 International by the European Southern Observatory.)

This is a fisheye image, with the band of the Milky Way and the horizon wrapped around the edge of the circle. Here the gegenschein is the broad glow centred around a third of the way from the centre, at the 1 o’clock angle.

The visibility of the gegenschein shows that, in places where it is night time, the sun is actually behind the Earth. On a flat Earth, the sun can never be behind the Earth, so the gegenschein would never be visible. And so the optical effect of backscatter provides evidence that the Earth is a globe.

References:

[1] Hong, S. S. “Henyey-Greenstein representation of the mean volume scattering phase function for zodiacal dust”. Astronomy and Astrophysics, 146, p. 67-75, 1985. http://adsabs.harvard.edu/abs/1985A%26A…146…67H

[2] Draine, B. T. “Scattering by Interstellar Dust Grains. I. Optical and Ultraviolet”. The Astrophysical Journal, 598, p. 1017-1025, 2003. https://doi.org/10.1086/379118

1. The Blue Marble

[audio version of this article]

The most straightforward way to check the shape of the Earth is to look at it. There’s one small problem, though. To see the shape of the Earth as a whole, you need to be far enough away from it. For most of human history, this has not been possible. It was only with the advent of the space age that our technology has allowed us to send a human being, or a camera, more than a few kilometres from the surface.

The earliest photo of the whole Earth from space was taken by NASA’s ATS-3 weather and communications satellite in 1967. The photo was taken from geostationary orbit, some 34,000 kilometres above the surface of the Earth, and shows most of the western hemisphere, with South America most prominent. And you can see quite clearly that the Earth is round. It looks spherical, for the other landmasses that we know are there are hidden around the other side, and there is foreshortening of the features near the edges which matches our experience with spherical objects.

ATS-3 image of Earth

Photo of Earth taken by NASA’s ATS-3 satellite in 1967. (Public domain image by NASA.)

A more famous image of Earth taken from space is the Blue Marble image, captured by the Apollo 17 astronauts on their way to the Moon in 1972. This photo was taken from a distance of about 45,000 kilometres.

Blue Marble image of Earth

The Blue Marble photo of Earth taken by Apollo 17 astronauts in 1972. (Public domain image by NASA.)

This image is clearer and it’s arguably easier to see the spherical shape of the planet. Both these photos were taken with the full hemisphere lit by the sun.

The Apollo 13 astronauts, in their ill-fated flight, captured a different view, with part of the Earth in darkness because the sun was not behind them.

Apollo 13 image of Earth

The Earth photographed by Apollo 13 astronauts in 1970. (Public domain image by NASA.)

Here it is even easier to get a feeling for the round, spherical shape of Earth, because our experience with the way light falls on round objects helps our minds make sense of the curved shadow.

Well, that’s pretty definitive. But what else do we have?